Using a Coral TPU is annoying because interfacing with it requires outdated libraries which may not be available a certain embedded system.
Instead, in this post I will reverse-engineer the process of interfacing with the Coral TPU.
As a result, I will be able to mock a simple driver that only requires USB to send data for inference, which works in Python without additional libraries.
All the software is available in my Github.
Note: This post is the result of many hours of reverse-engineering and research that happened chaotically, despite being presented linearly in this post. It is inspired by a series of videos by G. Hotz.
Introduction
Recently I got my hands on a Coral TPU. I wanted to run object detection locally on the video feed from my FPV drone.
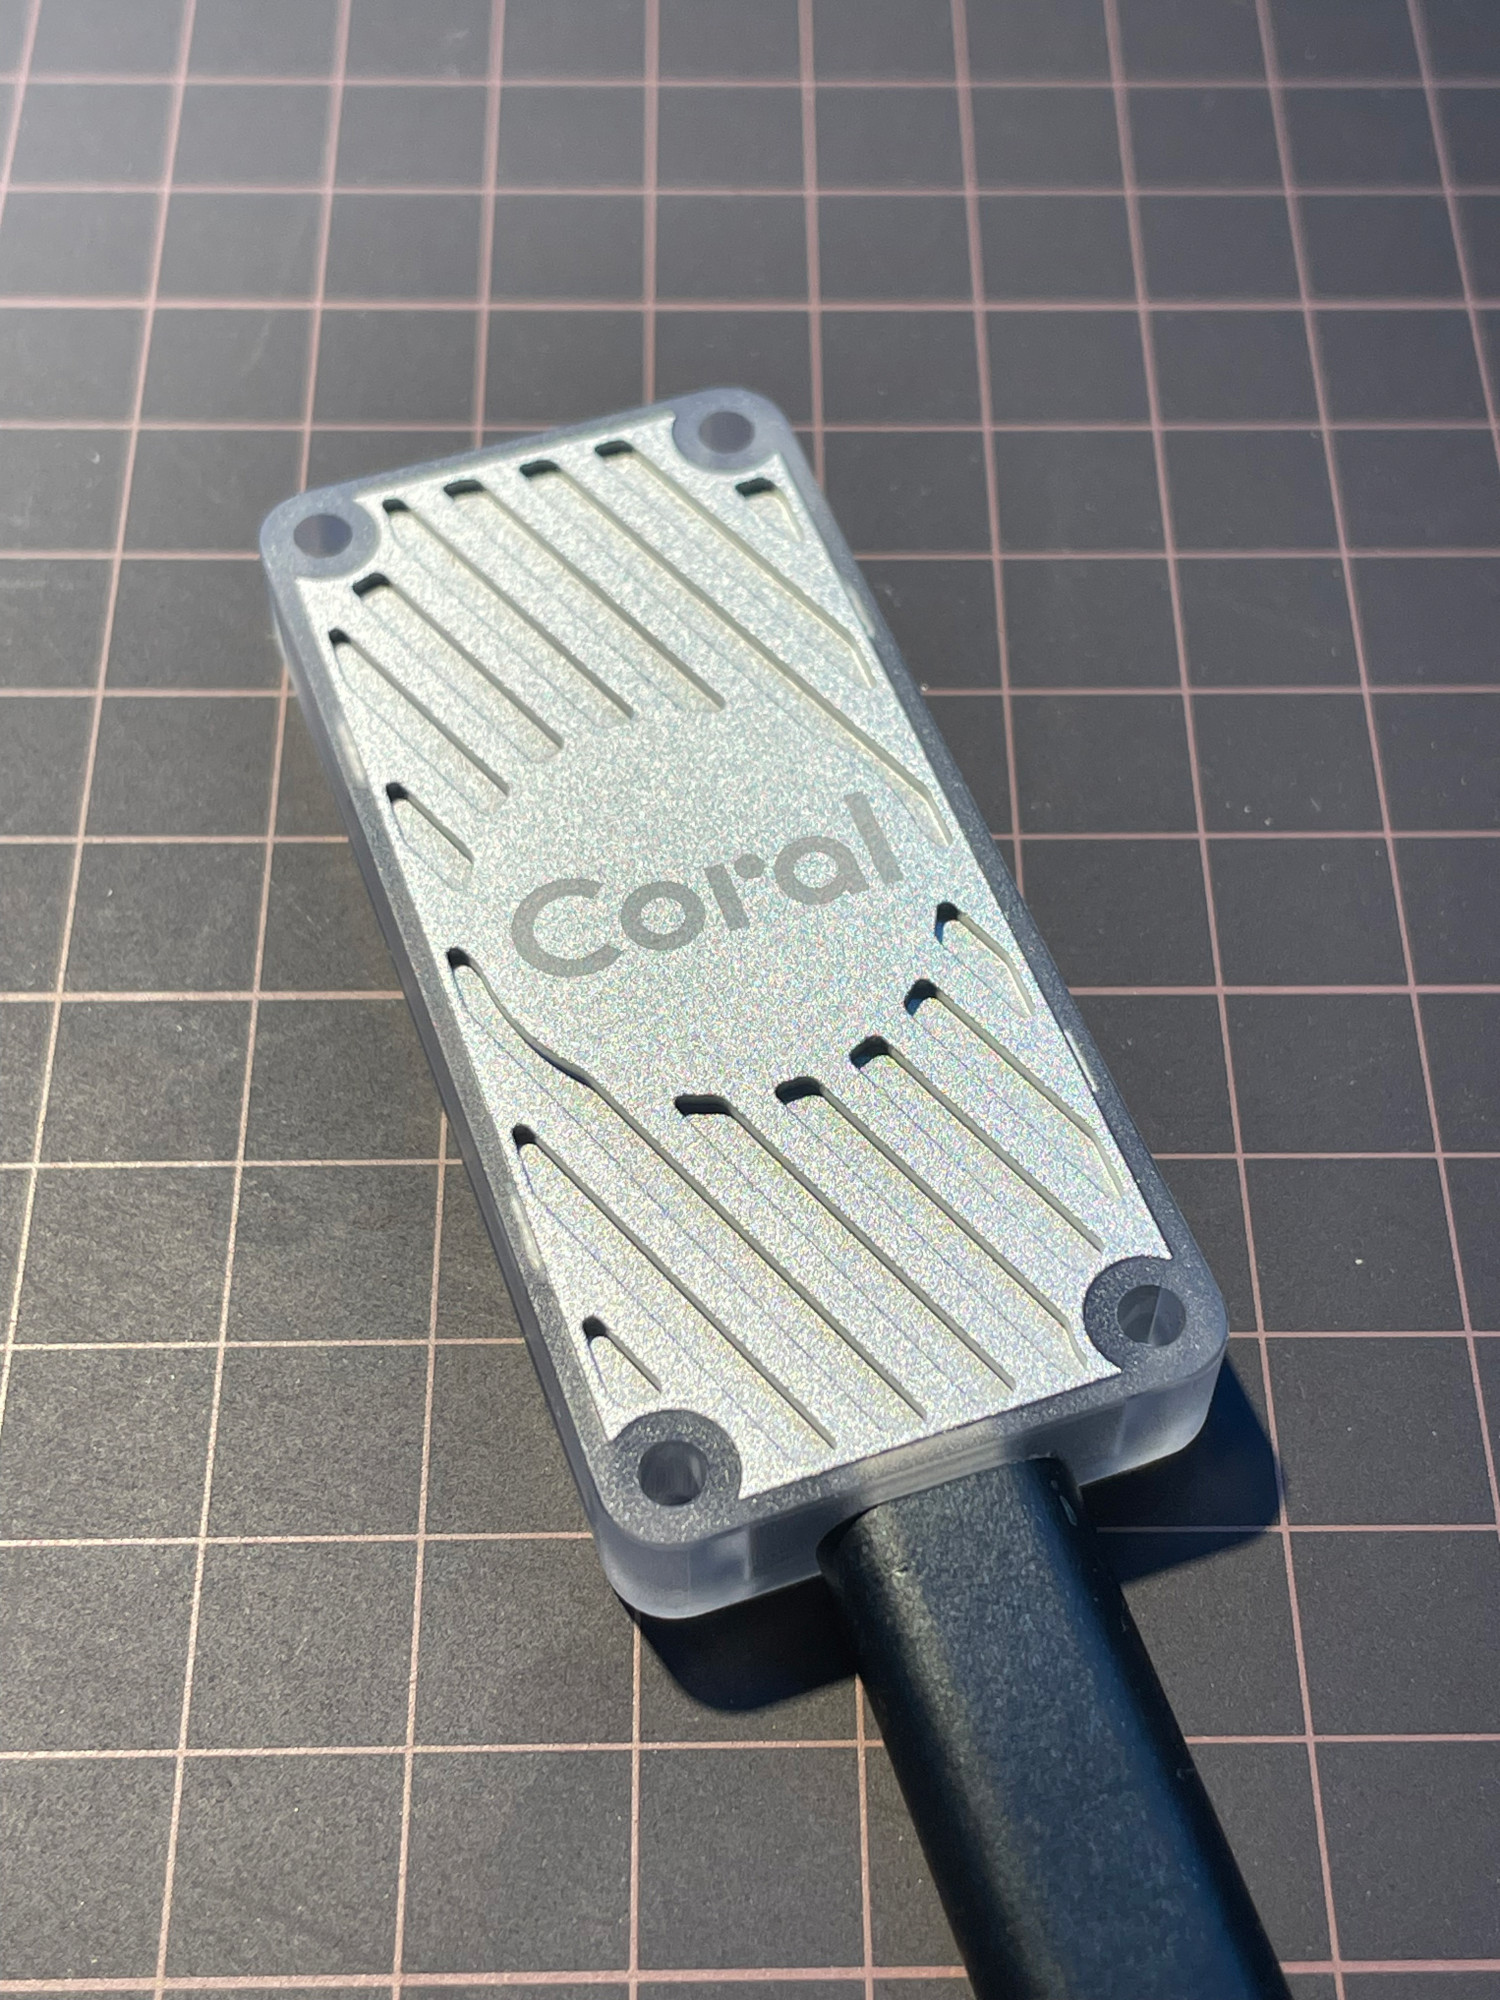
The idea was simple: use a small Raspberry Pi Zero W with a camera module connected to the TPU to run ML live on a video feed. I tried, but soon I figured out a problem: the Coral TPU software stack, old and outdated, is a nightmare to use.
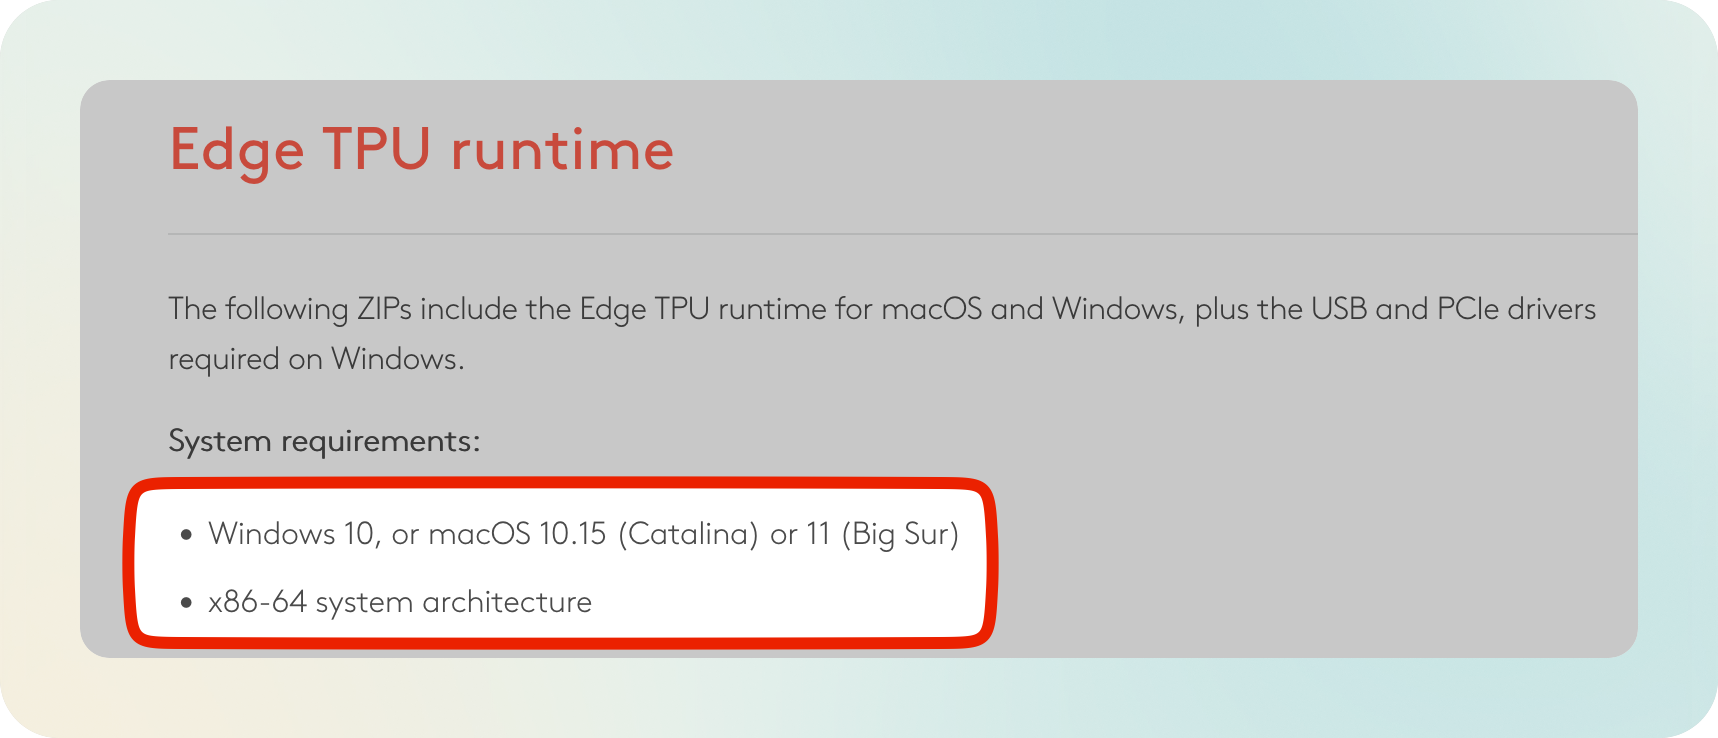
The Coral runtime library only supports 64-bit Linux while the Raspberry Pi Zero W runs in 32-bit.
What about building the runtime library locally? It can not be that difficult… Right?
Lesson: Avoid custom builds unless it is strictly necessary, specially with old software.
I gave up. Building it locally was a nightmare.
How could I get rid of the outdated and bloated software stack of the Coral TPU and use it directly? I just need to send a model and a picture, run inference, and get the response back!
I had an idea: I could intercept the USB data that my laptop was sending to the TPU and the response that the TPU was sending back after running the inference, and mimic that USB communication.
- Run inference on the Coral TPU as indicated in the docs using my laptop as host.
- Intercept the USB data sent back and forth.
- Mimic the USB communication from a different host (like my RPi Zero).
Once I got rid of all Coral libraries, a world of possibilities opened:
❗ Literally any device that supports USB can be integrated with a Coral TPU and use it to accelerate ML. FPGA? Exotic microcontroller? Custom embedded system?
Intercepting the USB communication
How can I intercept the USB communication happening between my laptop and the Coral USB Accelerator?
My first temptation was to use a USB sniffer. However, they are expensive. I wanted a software solution. Surprisingly, I couldn’t find any convincing open-source projects for USB analysis. Either I found private -and pricy- options, or programs of questionable appearance. I had to try a different approach.
Presumably, the Coral USB Accelerator should use some USB library to communicate. Can I hook functionality to extract what such library is doing under the hood?
I started by installing Edge TPU Runtime, the Coral runtime library, by following the getting started docs.
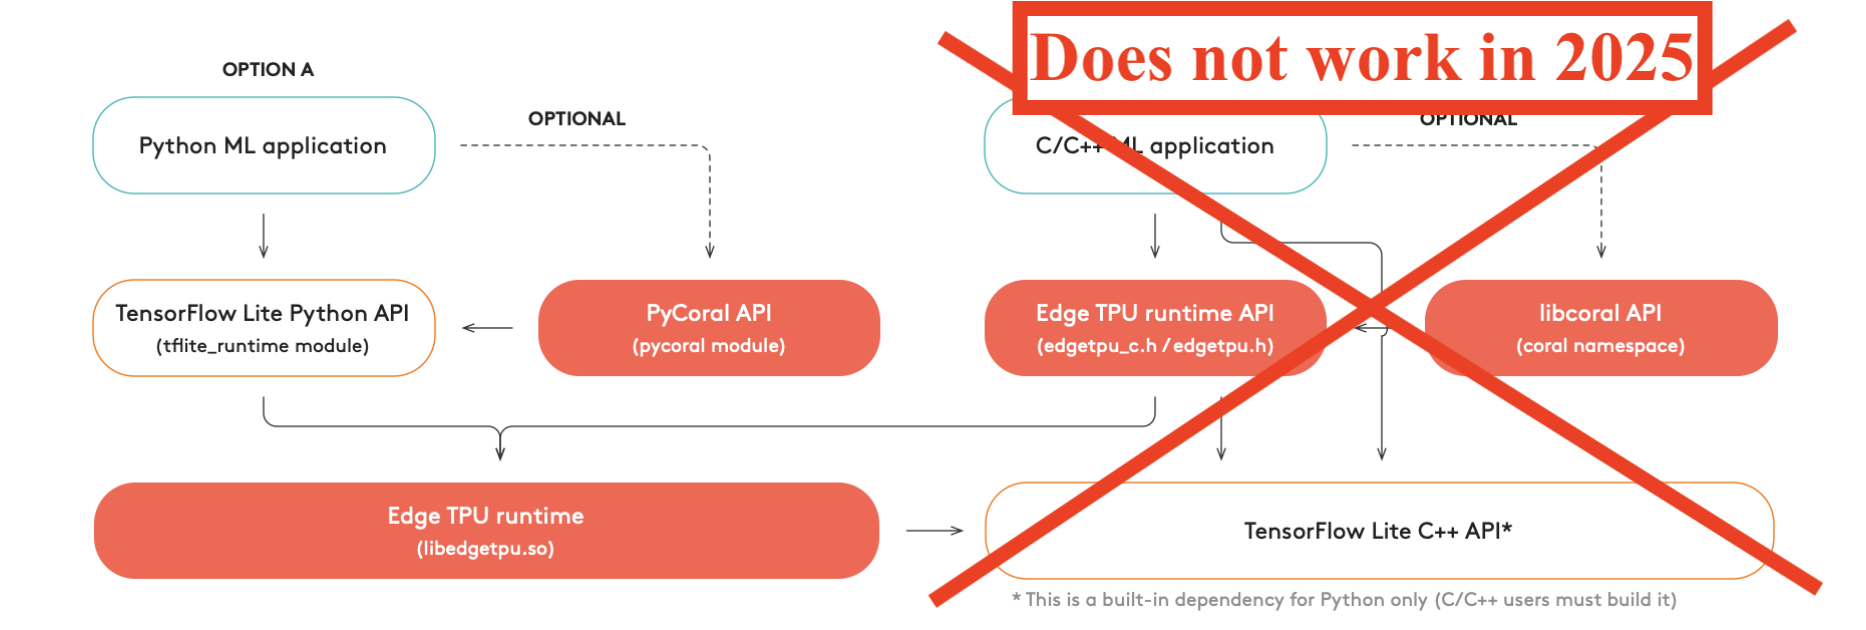
The Edge TPU Runtime library is a C++ dynamic library called libedgetpu. On top of it, the Coral SDK provides Python and C++ interfaces. I ended up using PyCoral, the Python interface, since I could not get to work the C++ library, libcoral.
In my system, the installed library was libedgetpu-1.0.dylib. Can I poke inside to see its dependencies?
otool -L libedgetpu-1.0.dylib
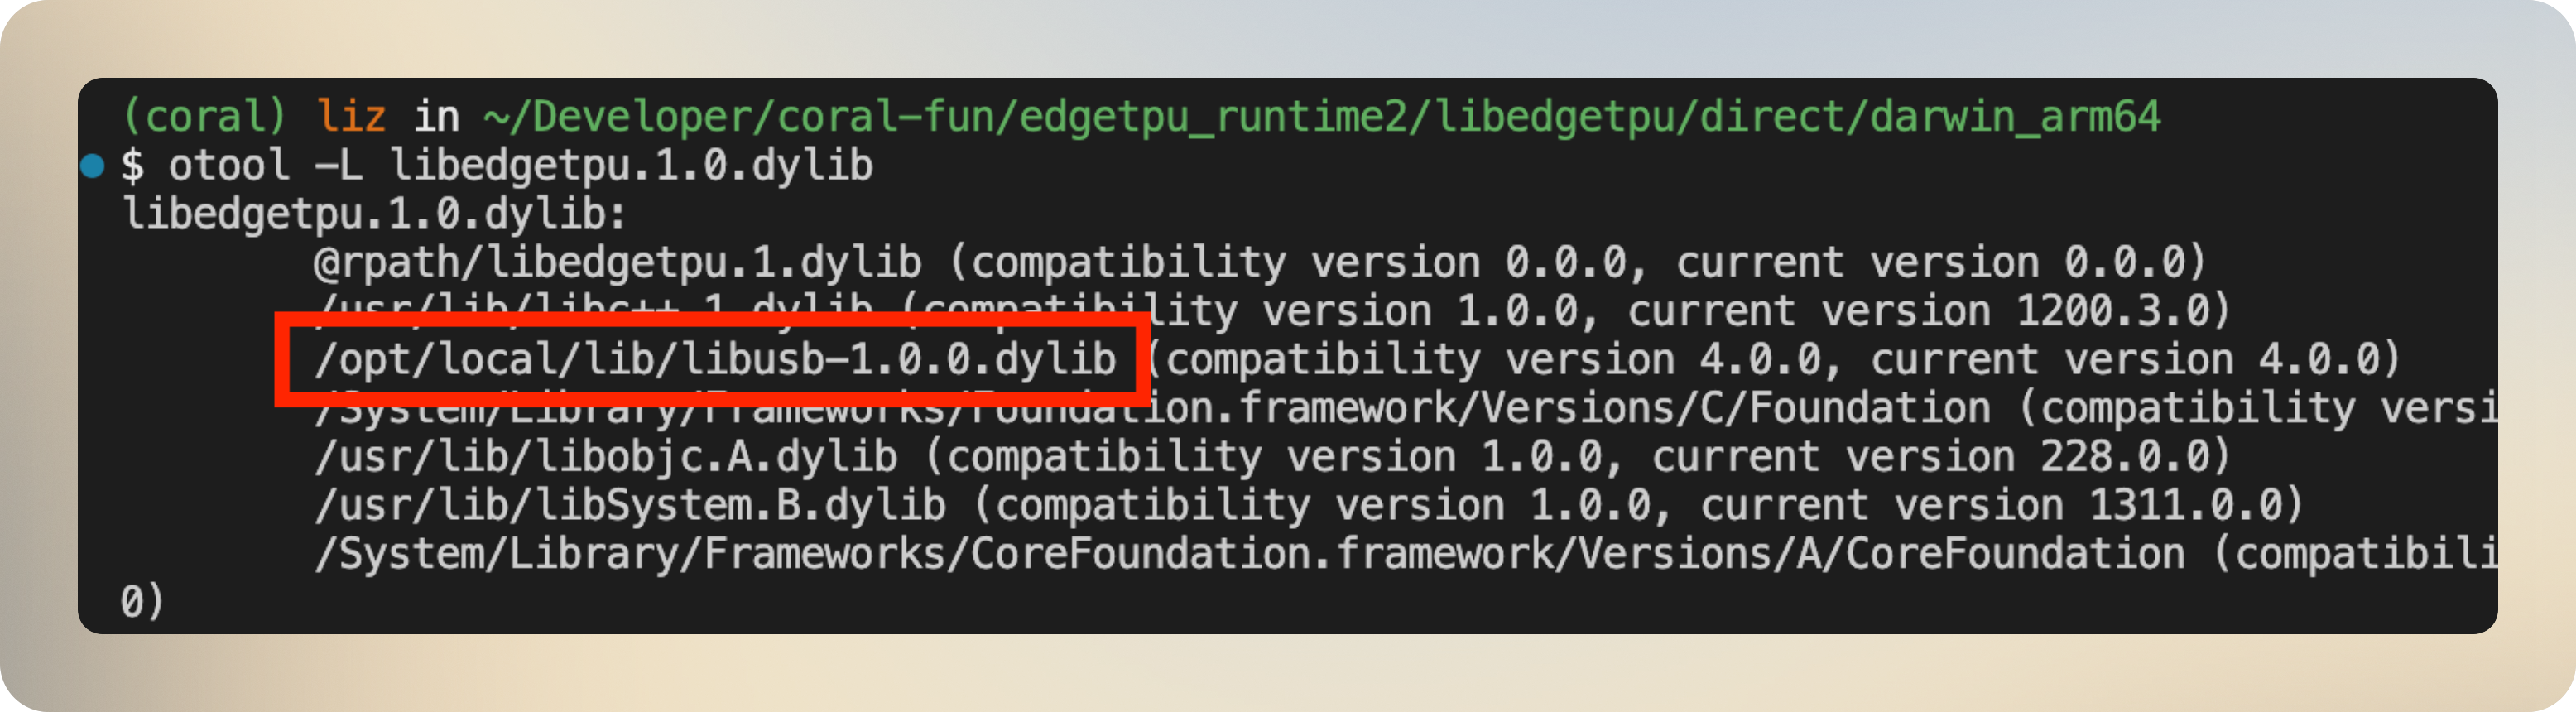
It’s using libusb, a well-known library, to handle the USB communication!
Could I replace the builtin libusb with a custom libusb engineered to log the communication? Indeed:
- Clone
libusb, modify the source code to log communication, and build. - Link
libedgetpu-1.0.dylibto the verbose version oflibusbusinginstall_name_tool -change
I tested this by adding a printf() to the source code of libusb:
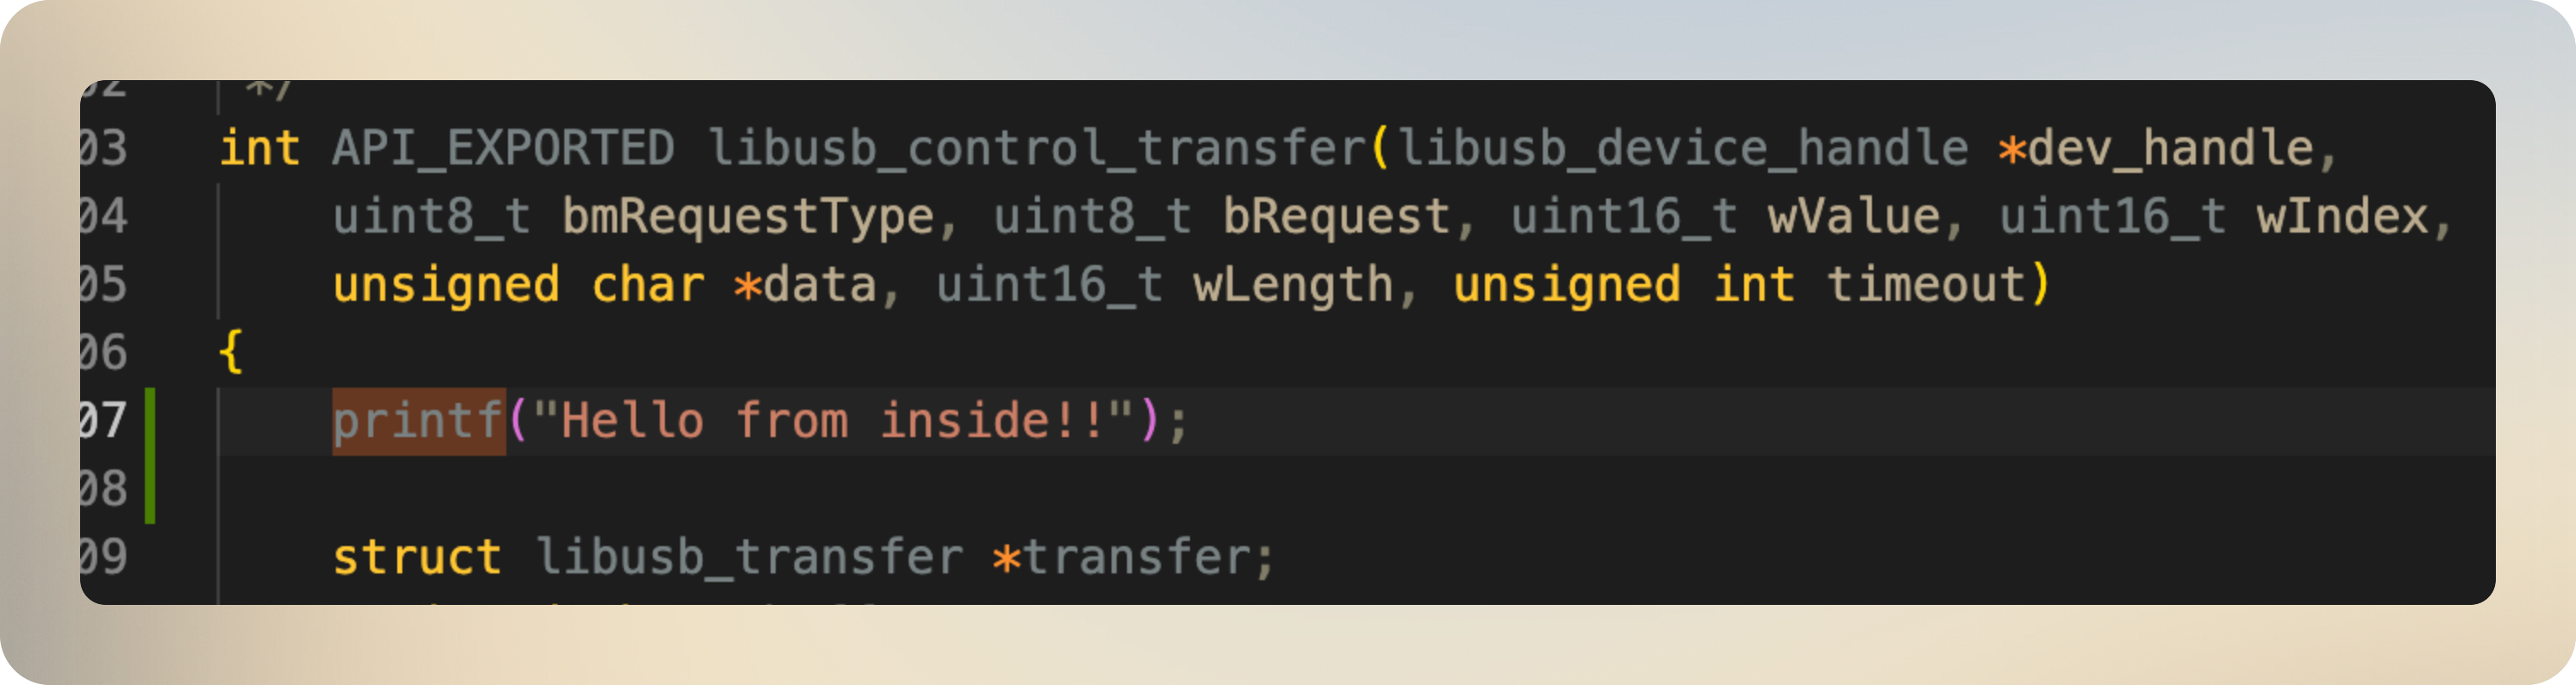
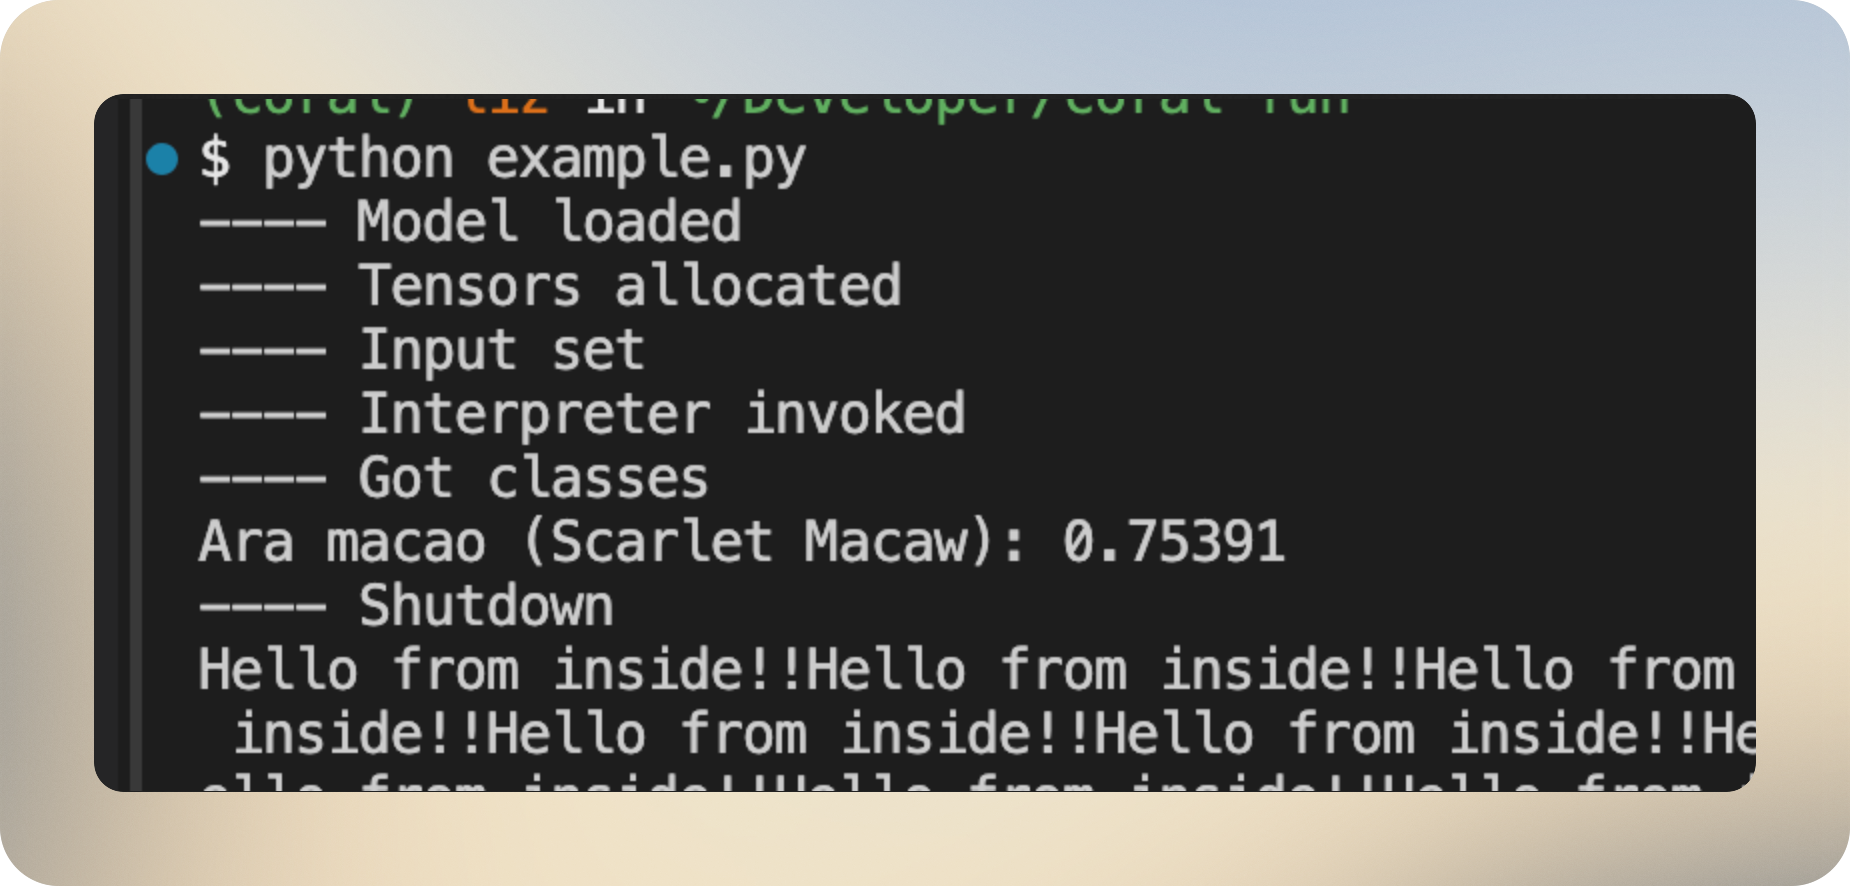
After linking and running the model, I can see the printed lines in the console:
Inspecting image classification
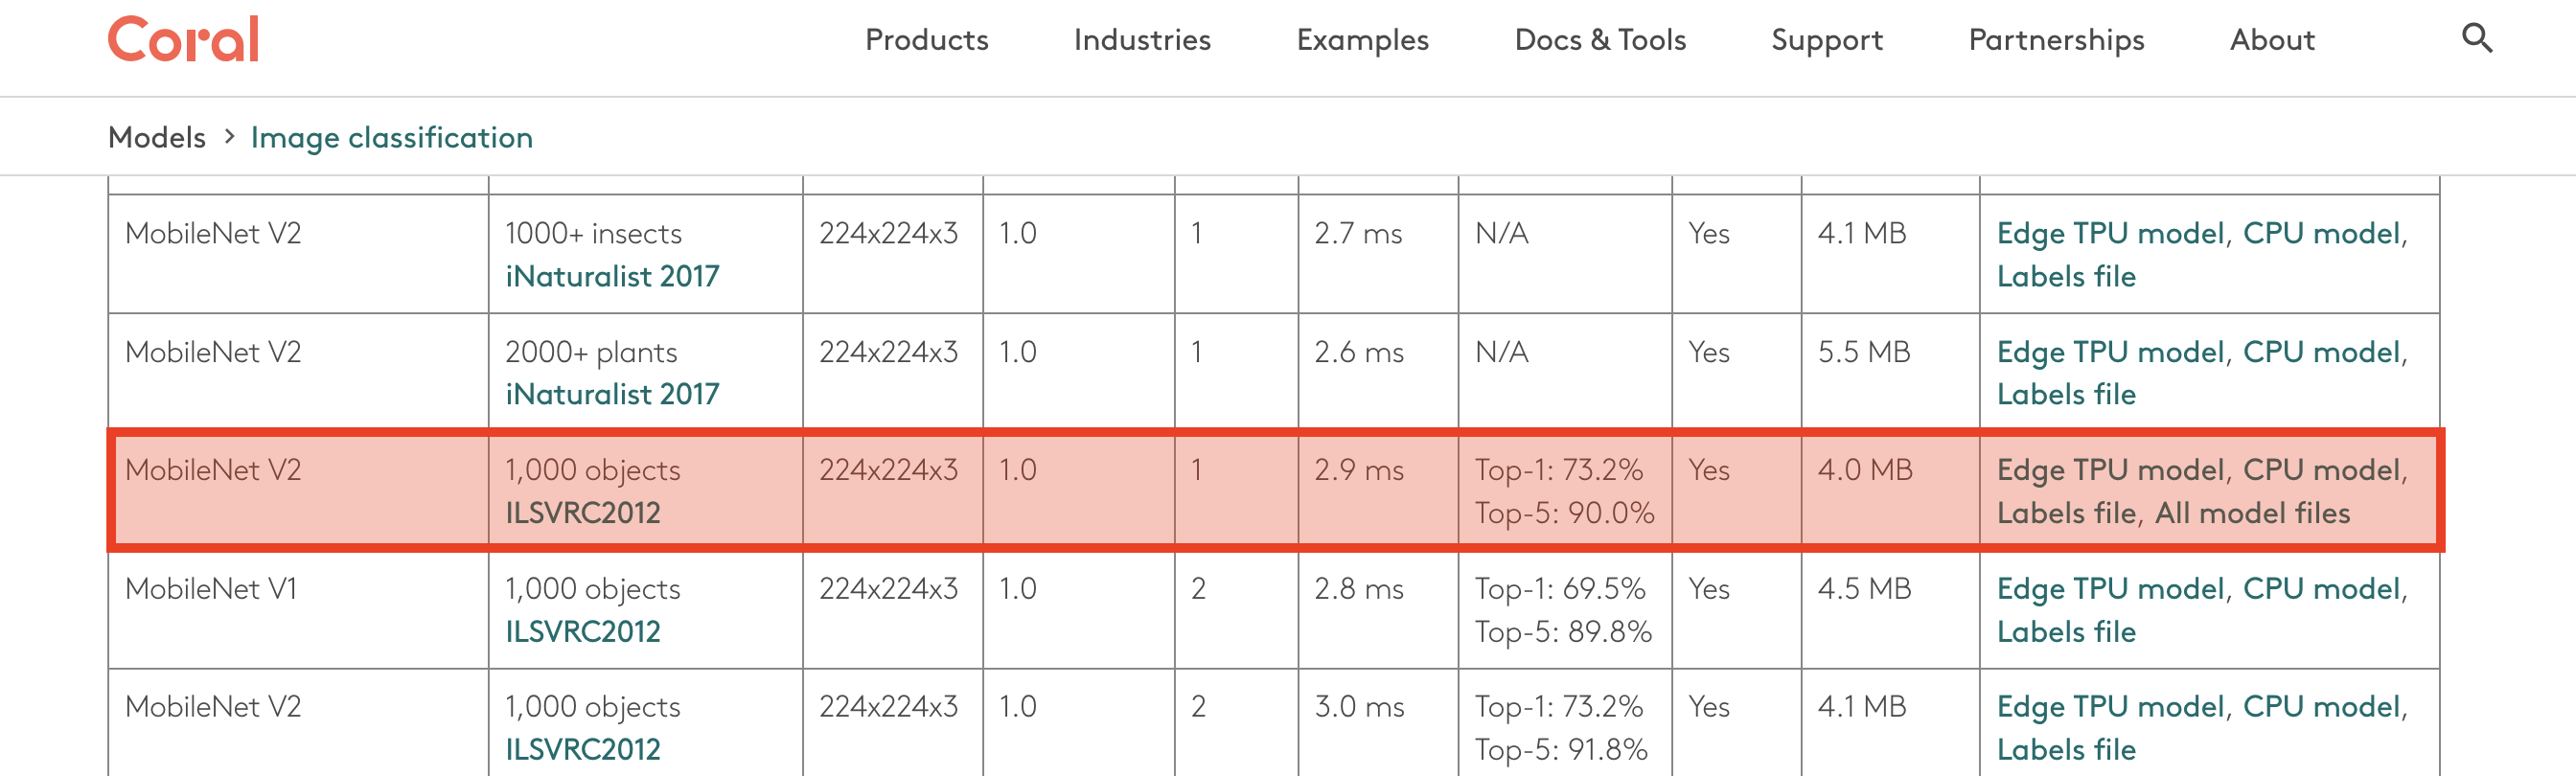
Google provides a variety of models adapted for the Coral TPU in its model zoo. I’ll use MobileNet V2, one of the available classification models:
What the hex?
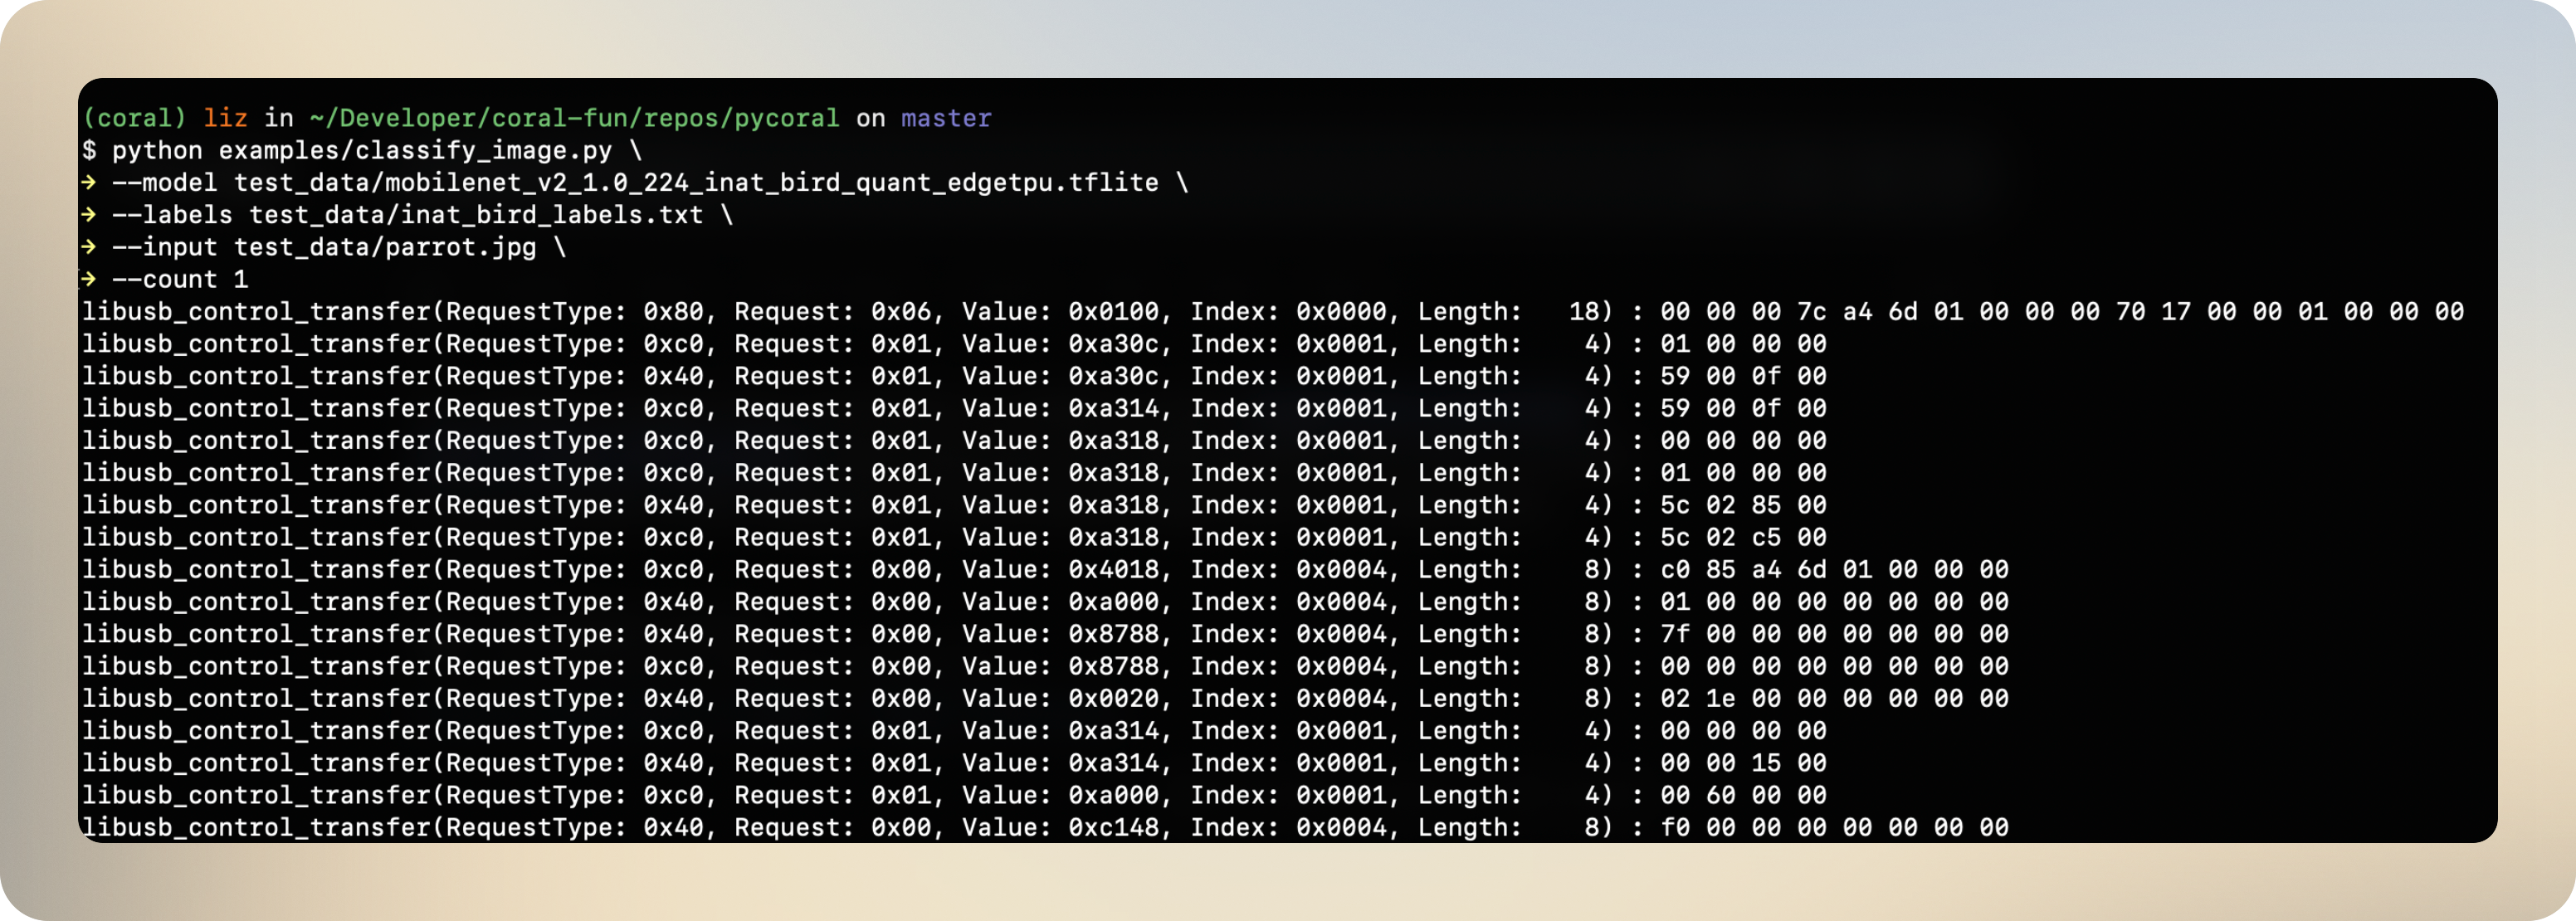
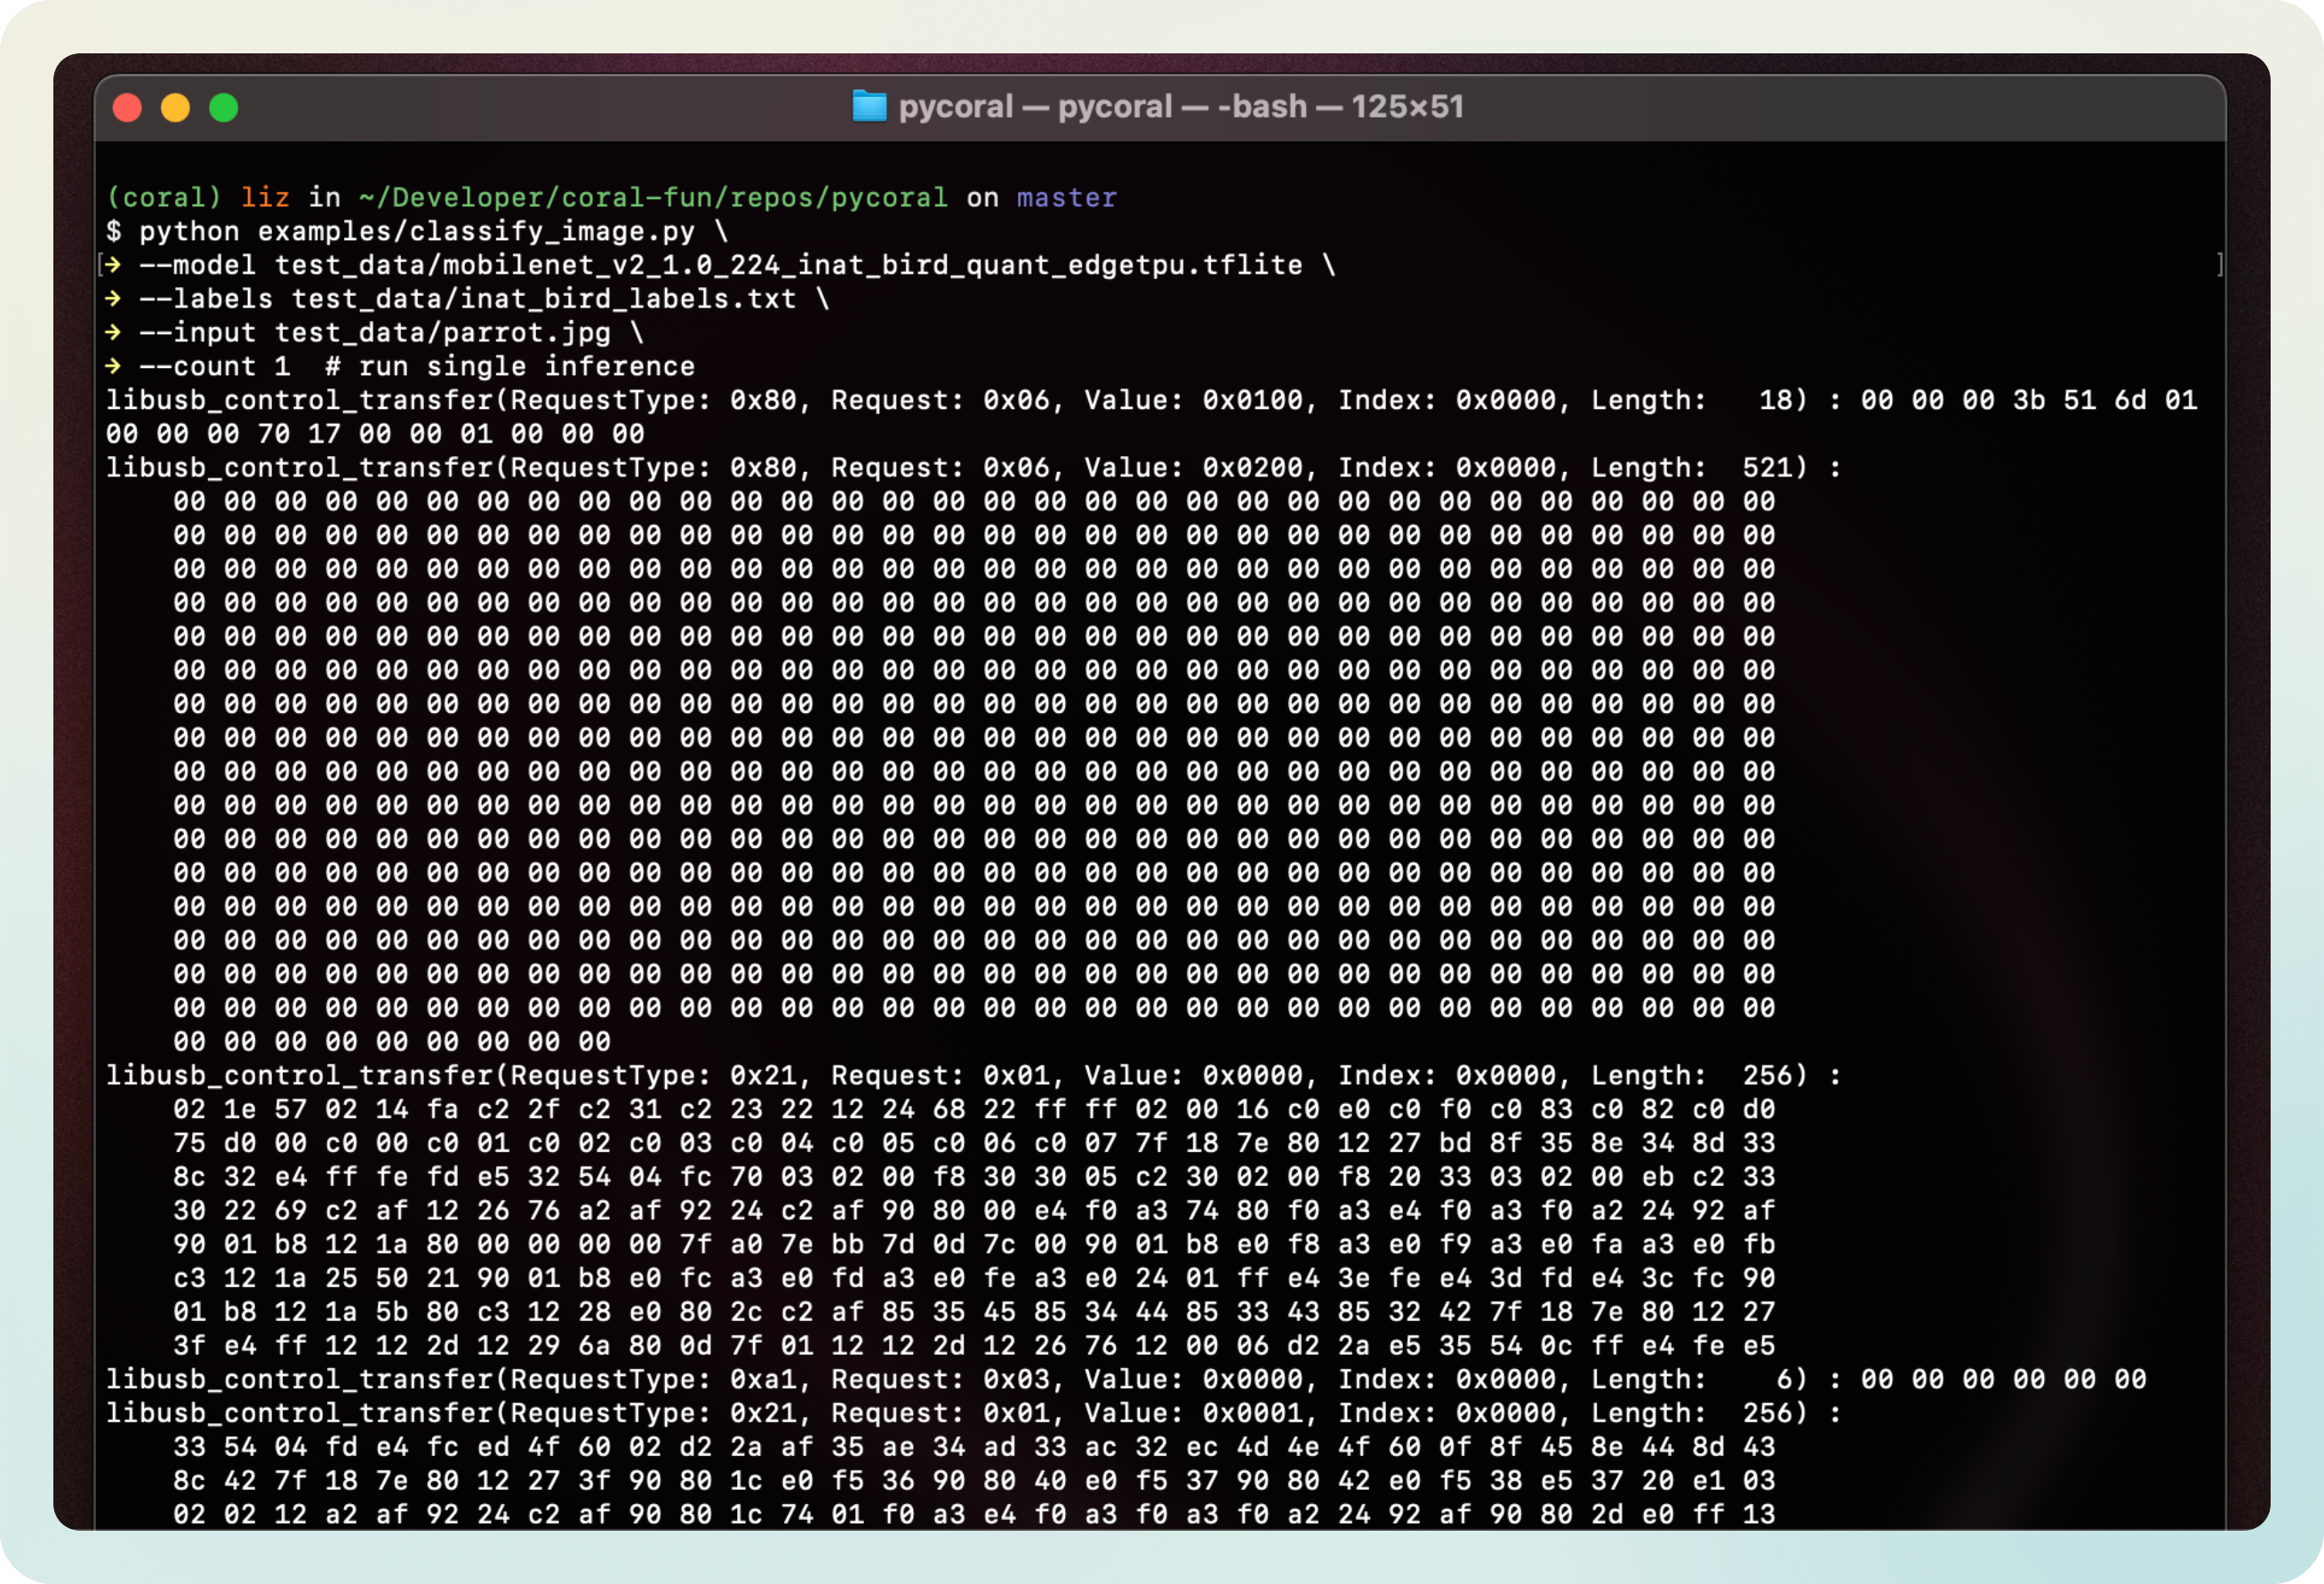
When you follow the official Coral TPU installation guide, the first thing to do is to run a classification over a parrot:
python pycoral/examples/classify_image.py \
--model test_data/mobilenet_v2_1.0_224_inat_bird_quant_edgetpu.tflite \
--labels test_data/inat_bird_labels.txt \
--input test_data/parrot.jpg \
--count 1  # run single inference
If you remember, in the previous section I modified the libusb library to log the data as it flows into and out from the TPU.
The following image is one of the logger methods I added to libusb, which is called when libusb_control_transfer() is invoked:
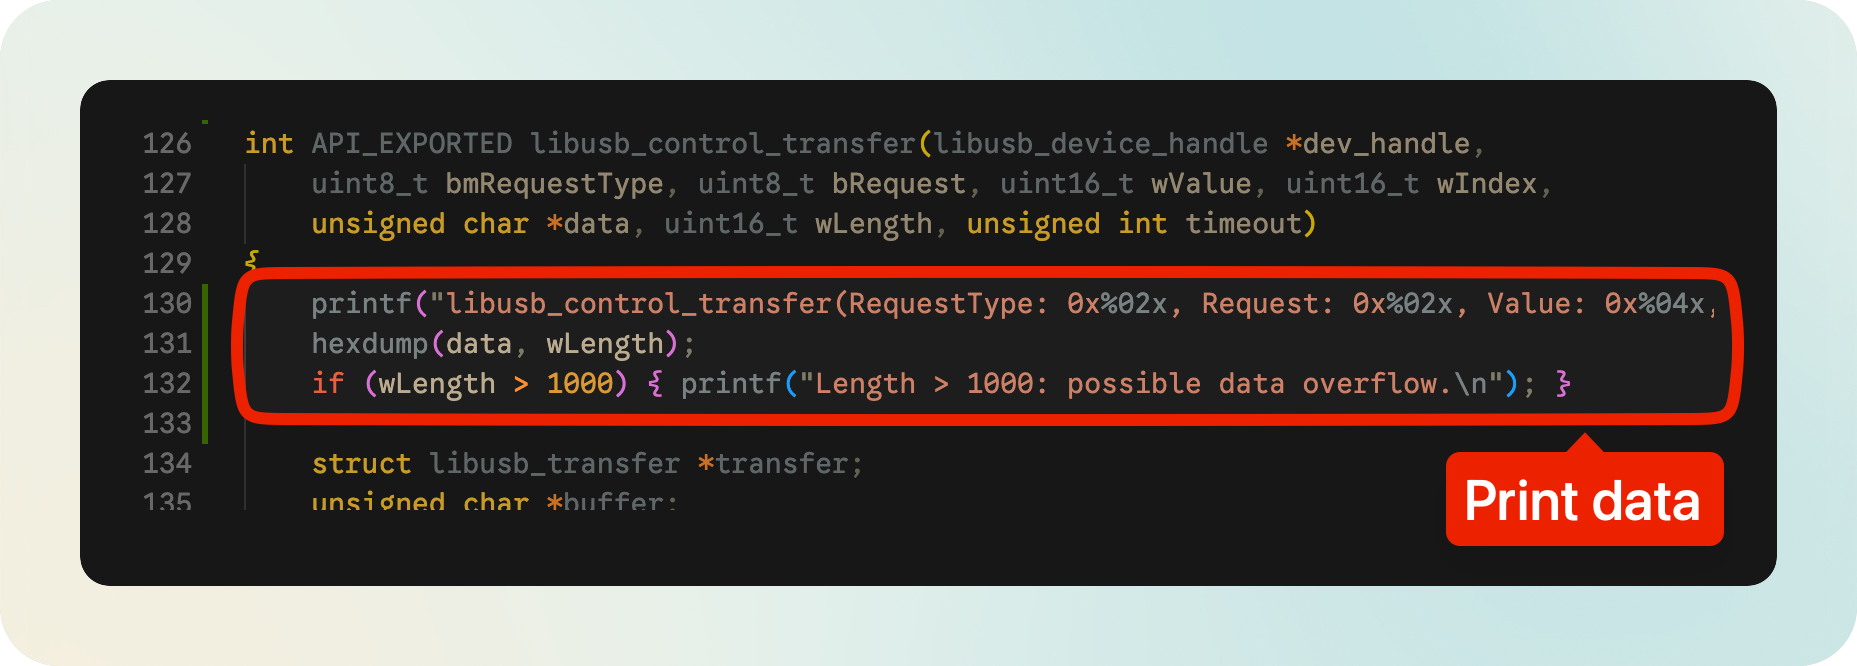
Note: Besides Control Transfers, I also added logger methods to other types of transfers (Submit and Bulk transfers). Initially, I didn’t know which ones will be used. Later we will see that Control and Submit are the main ones used.
Thus, when running the image classification now we get the following mysterious stream of hex data in the console. If you’re curious, you can see the whole file.
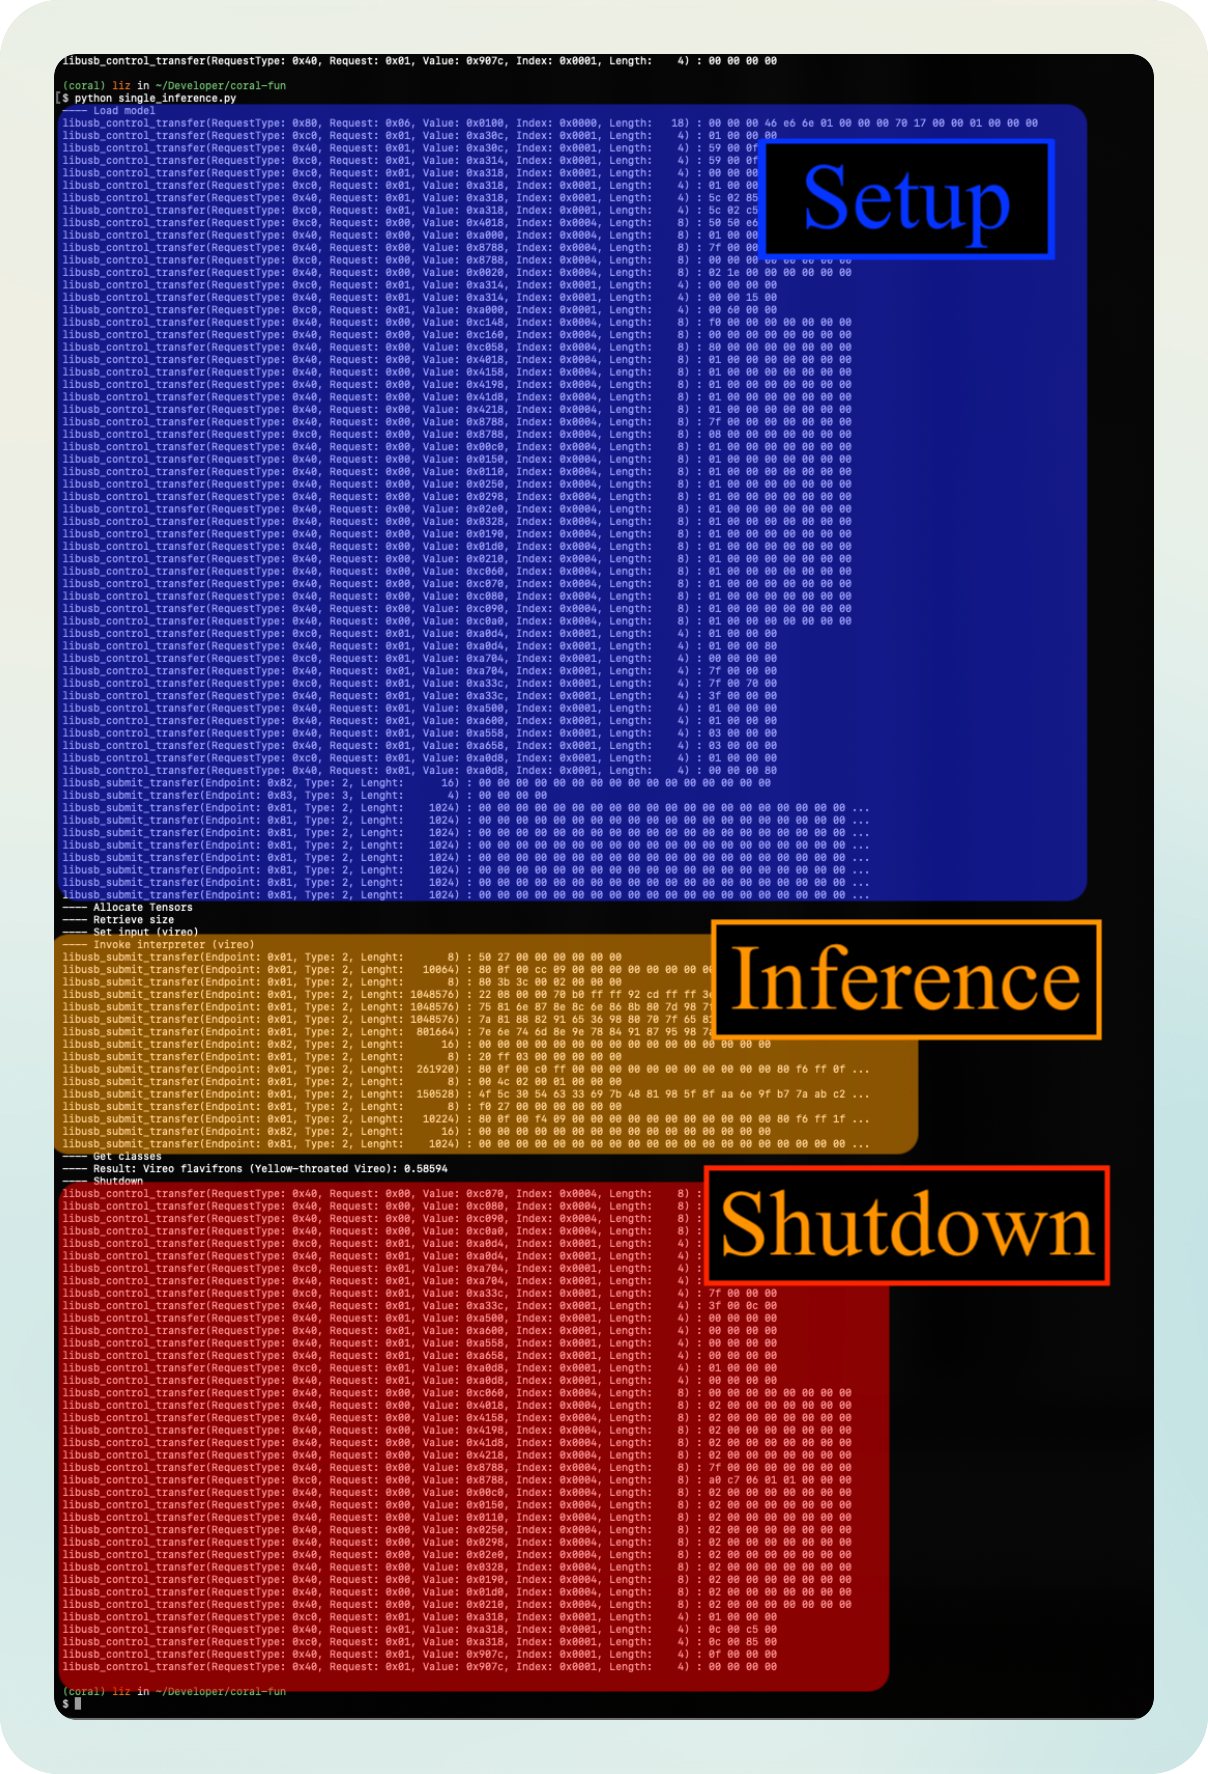
And zooming out, this is what the whole blob looks like:
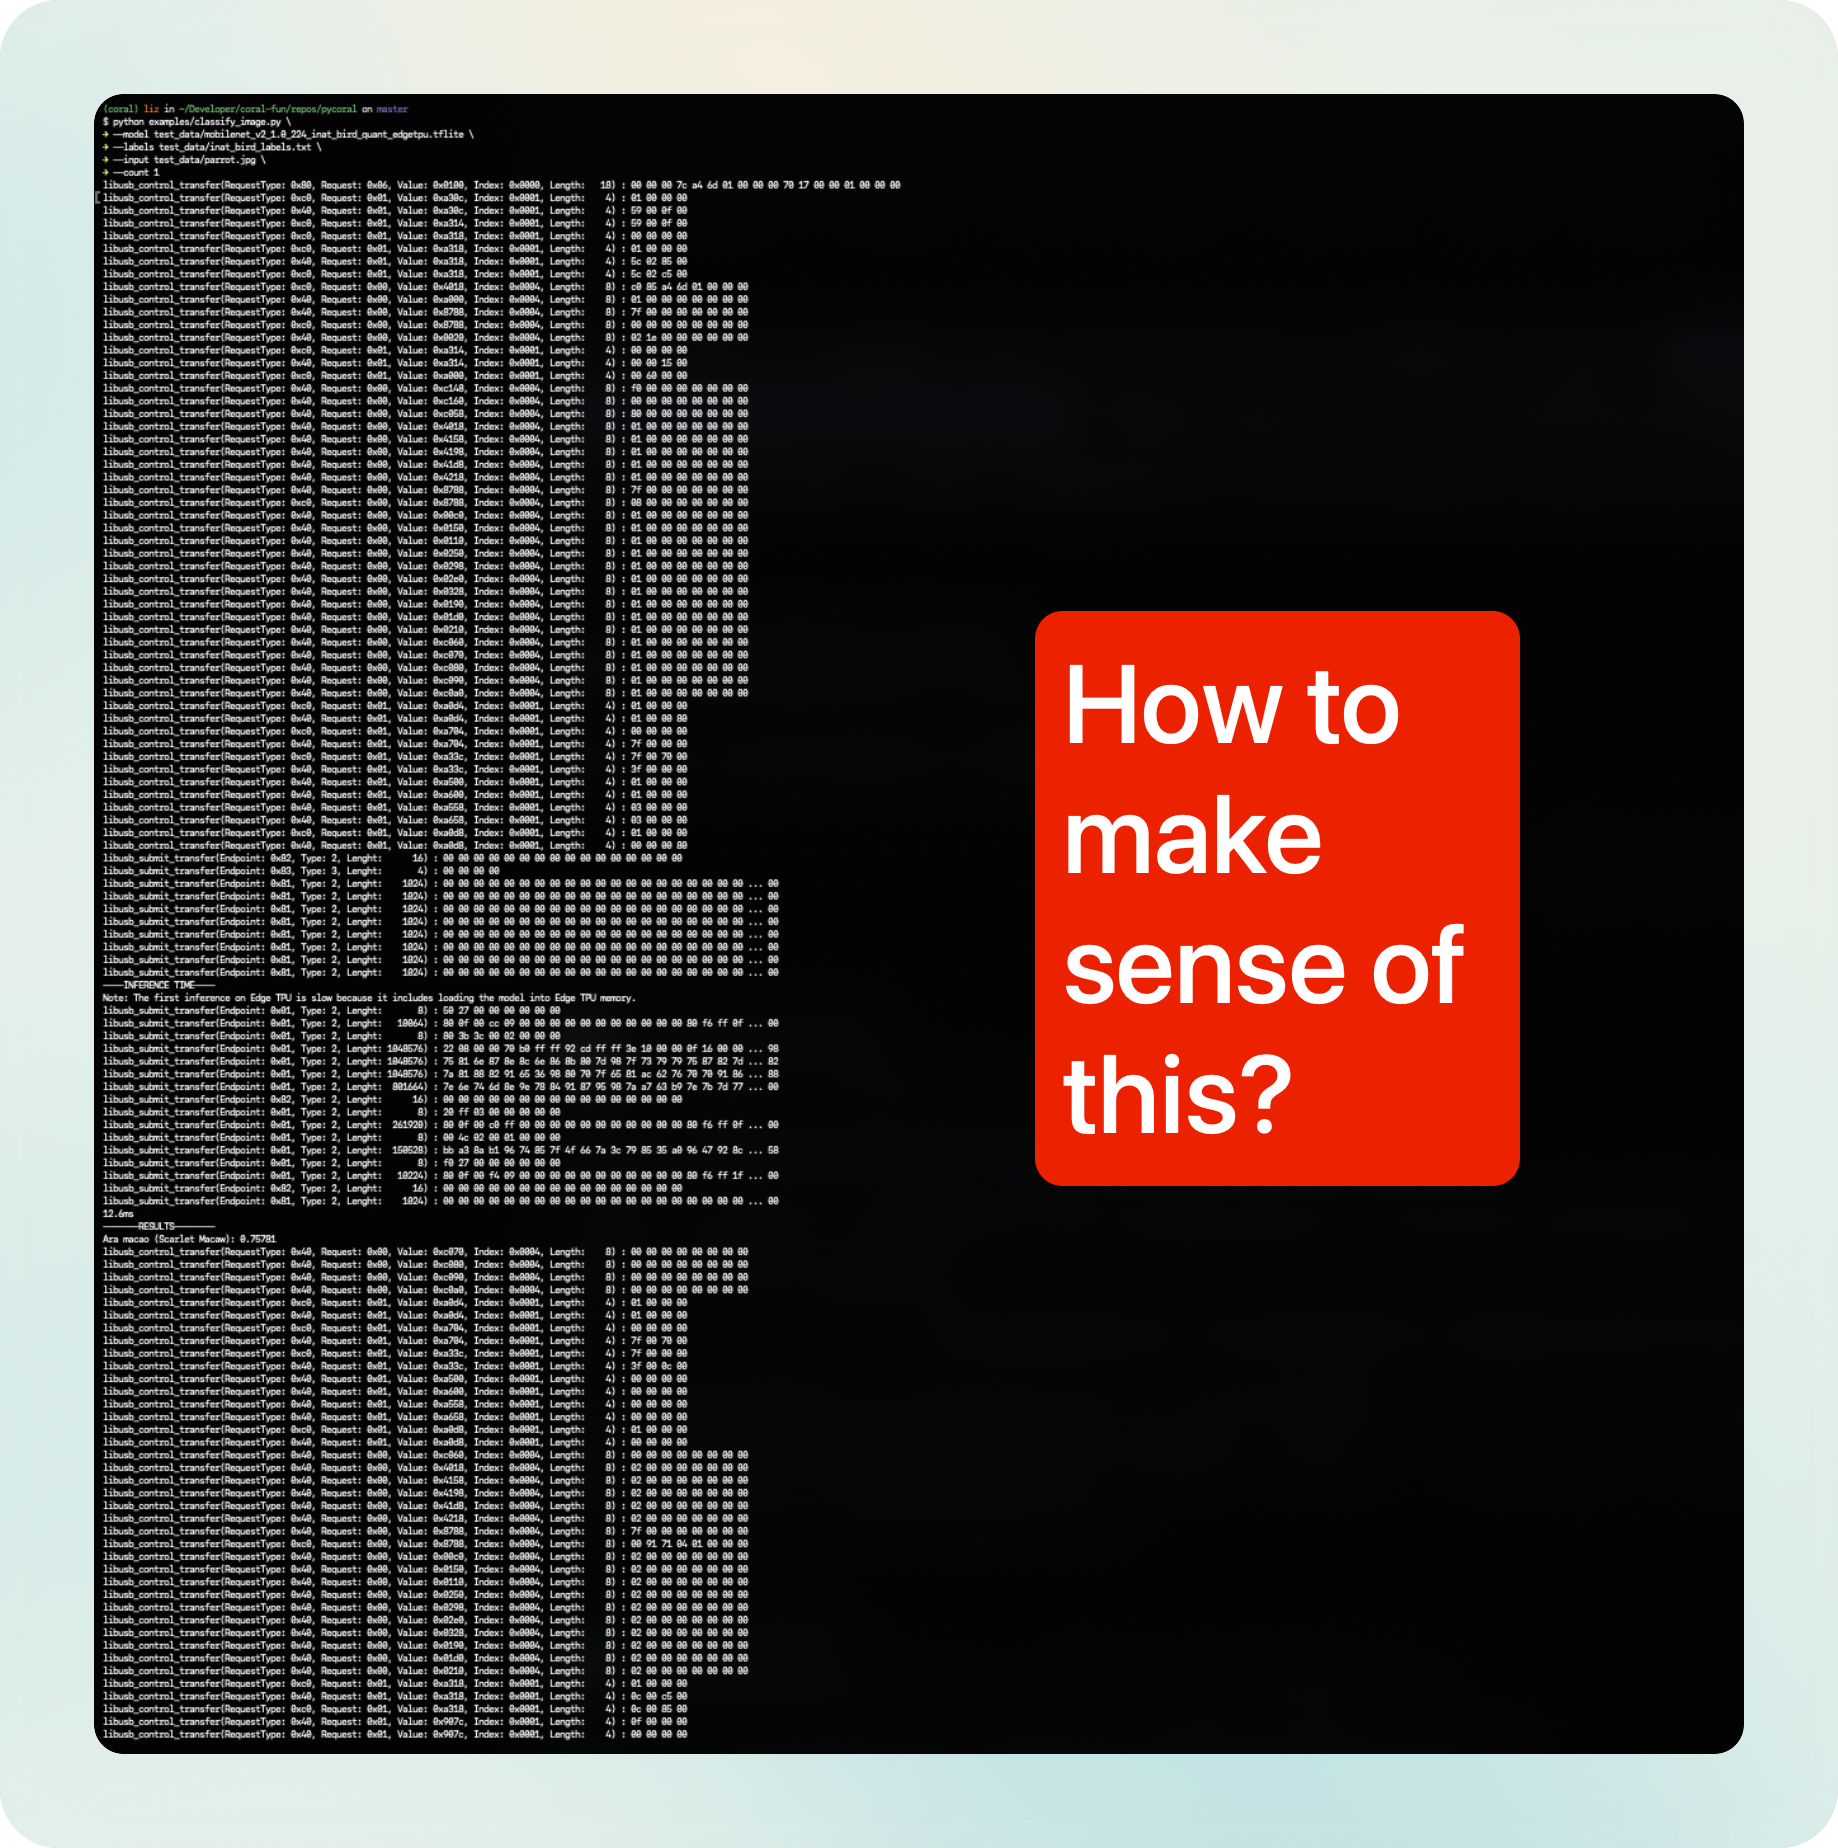 How can we make sense of it?
Making sense of the hex data
When I reverse-engineer, I look for:
- Visual patterns
- Behaviour or structural changes that follow input changes
- Numerical values known before hand
For example, there are some facts about the inputs that we know and we can use to search for patterns:
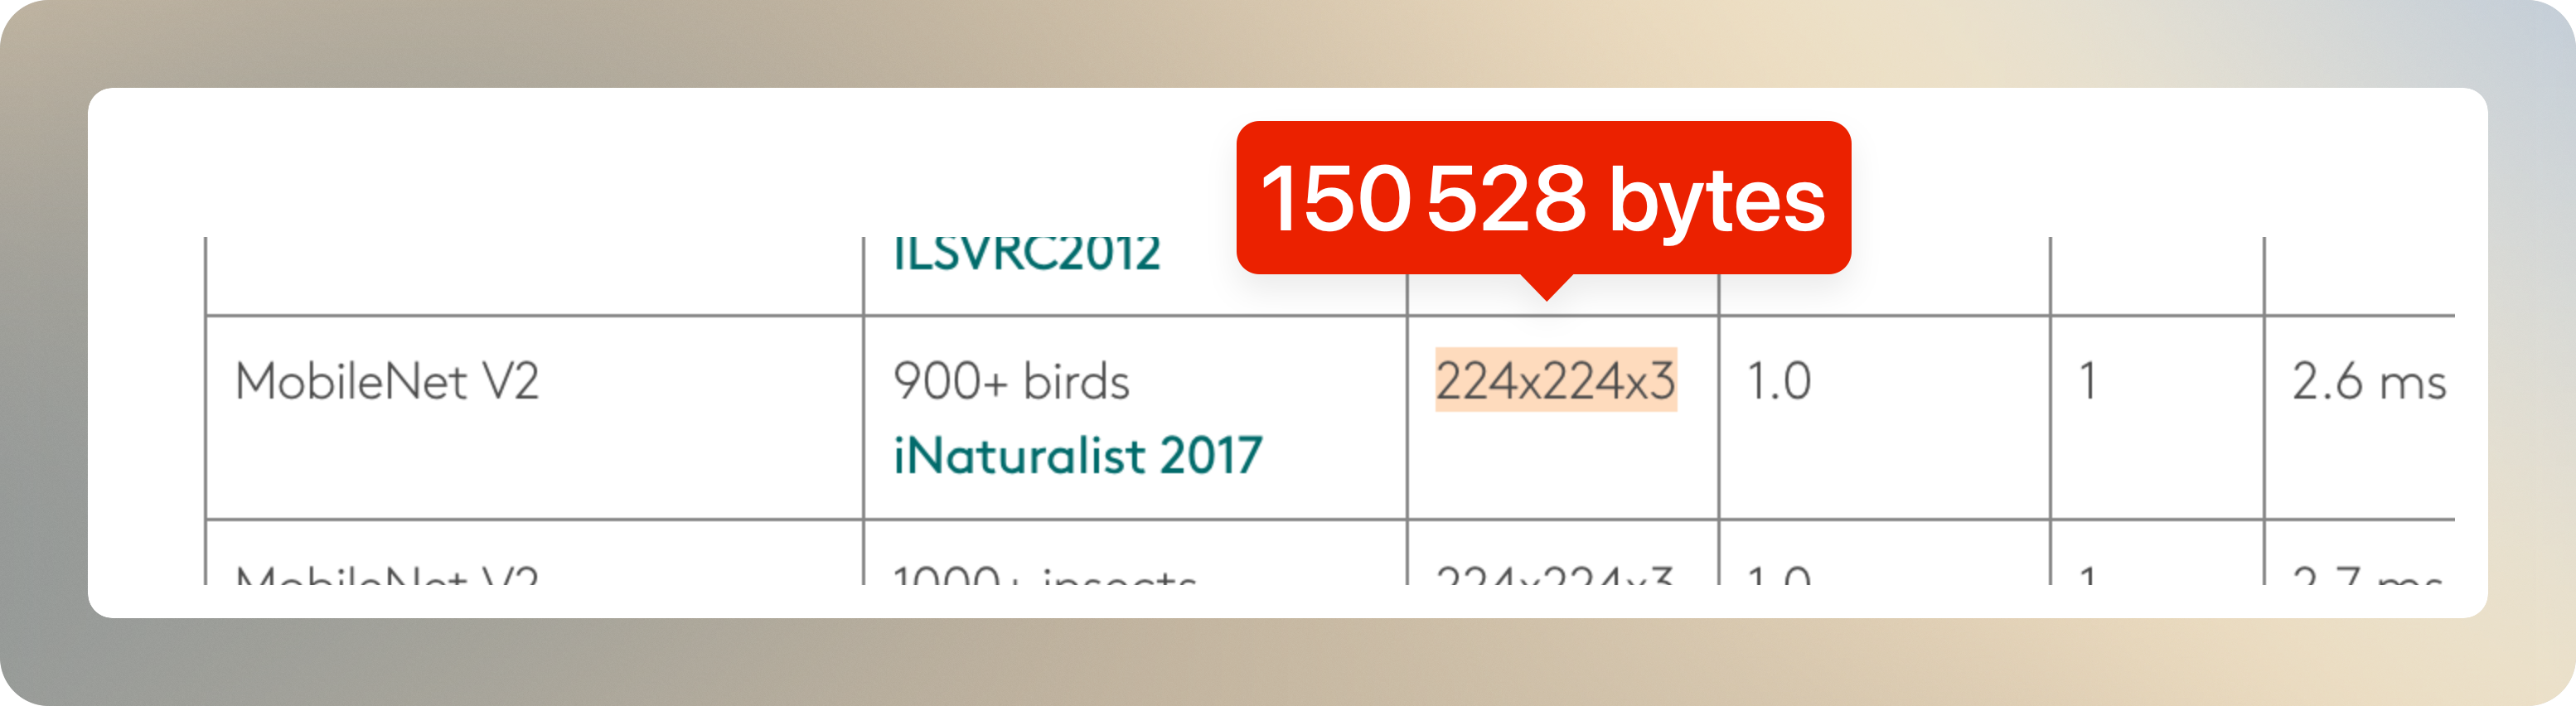
mobilenet_v2_1.0_224_inat_bird_quant_edgetpu.tfliteexpects a 224x224x3 input tensor. That’s 150528 bytes.
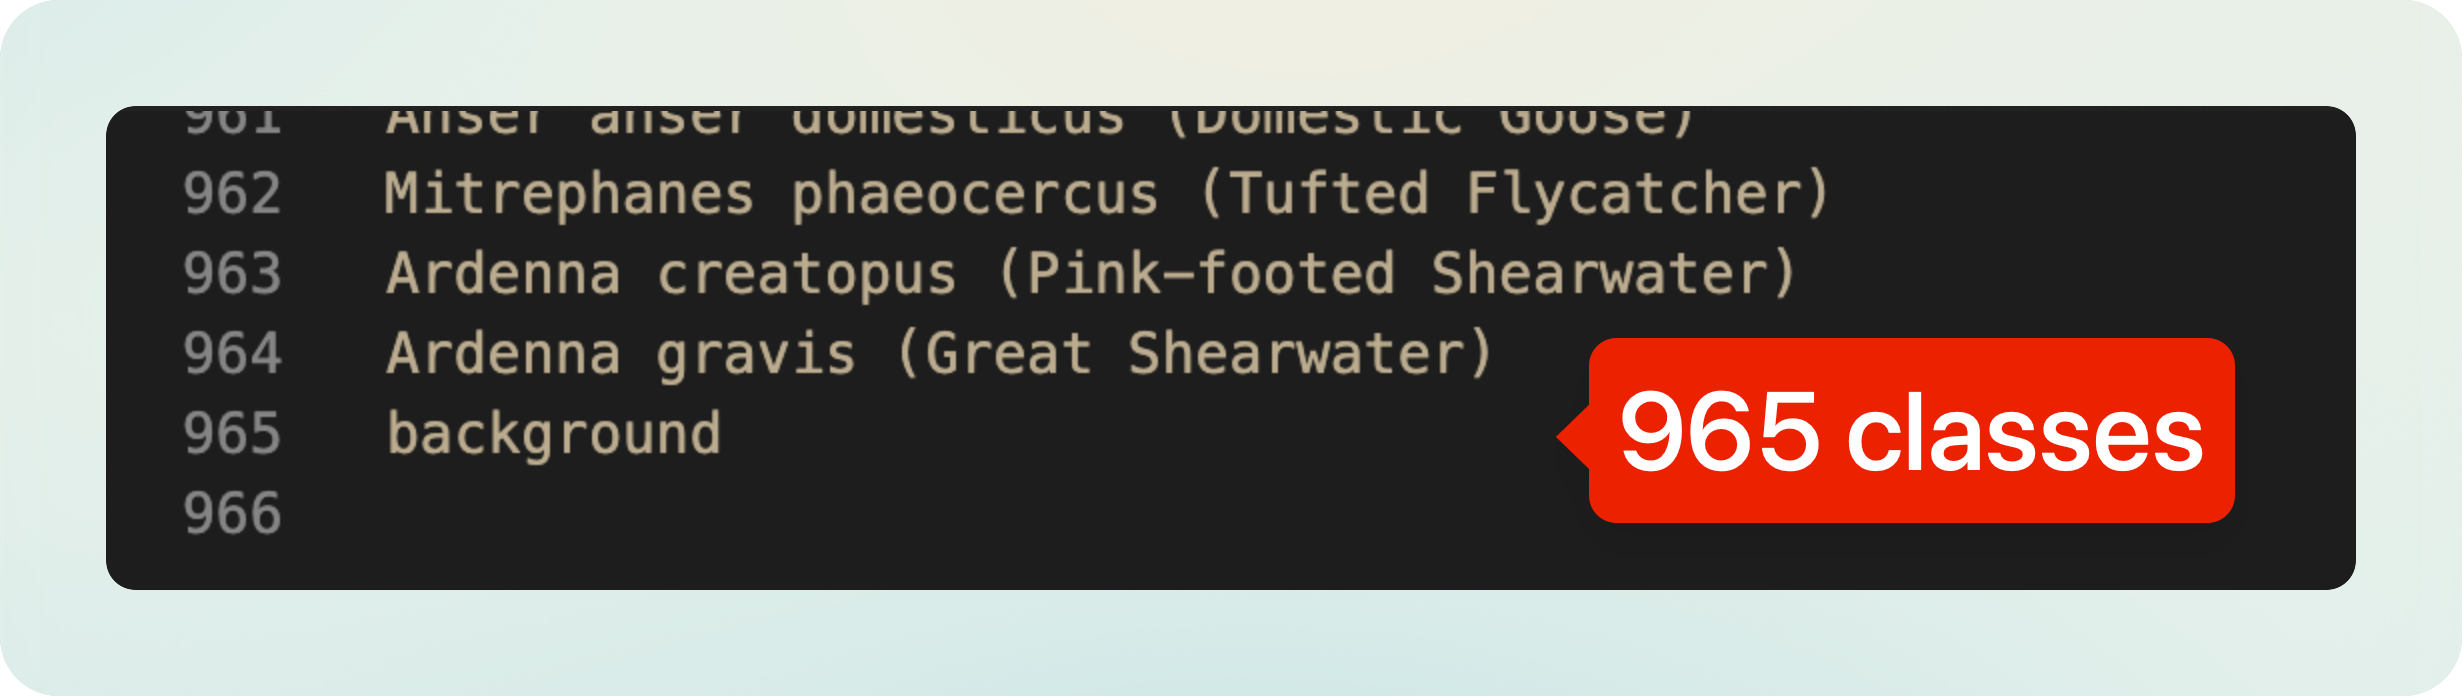
inat_bird_labels.txtcontains 965 classes, which probably are padded to the closest power of 2 (1024).
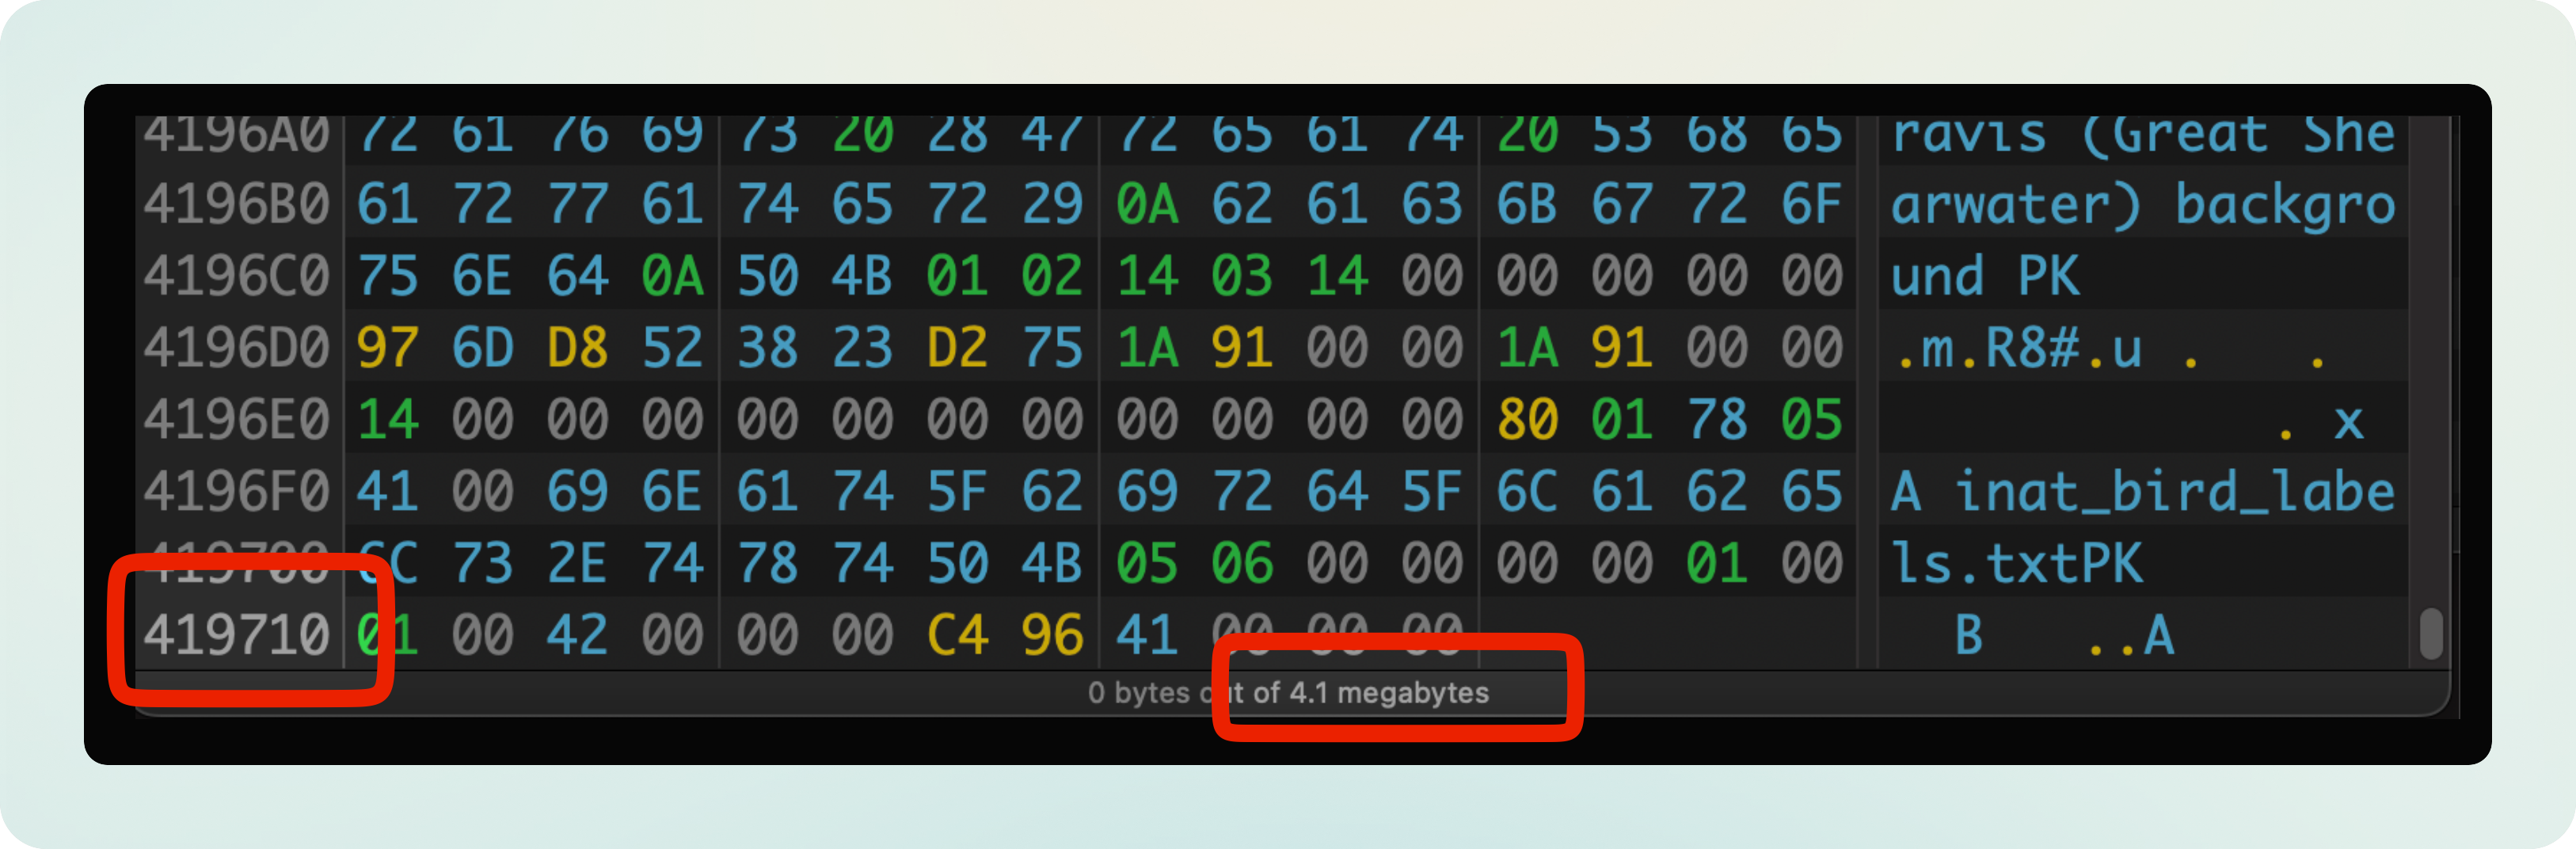
mobilenet_v2_1.0_224_inat_bird_quant_edgetpu.tfliteis ~ 4.1 MB in size. It contains 0x419710 = 4298512 bytes.
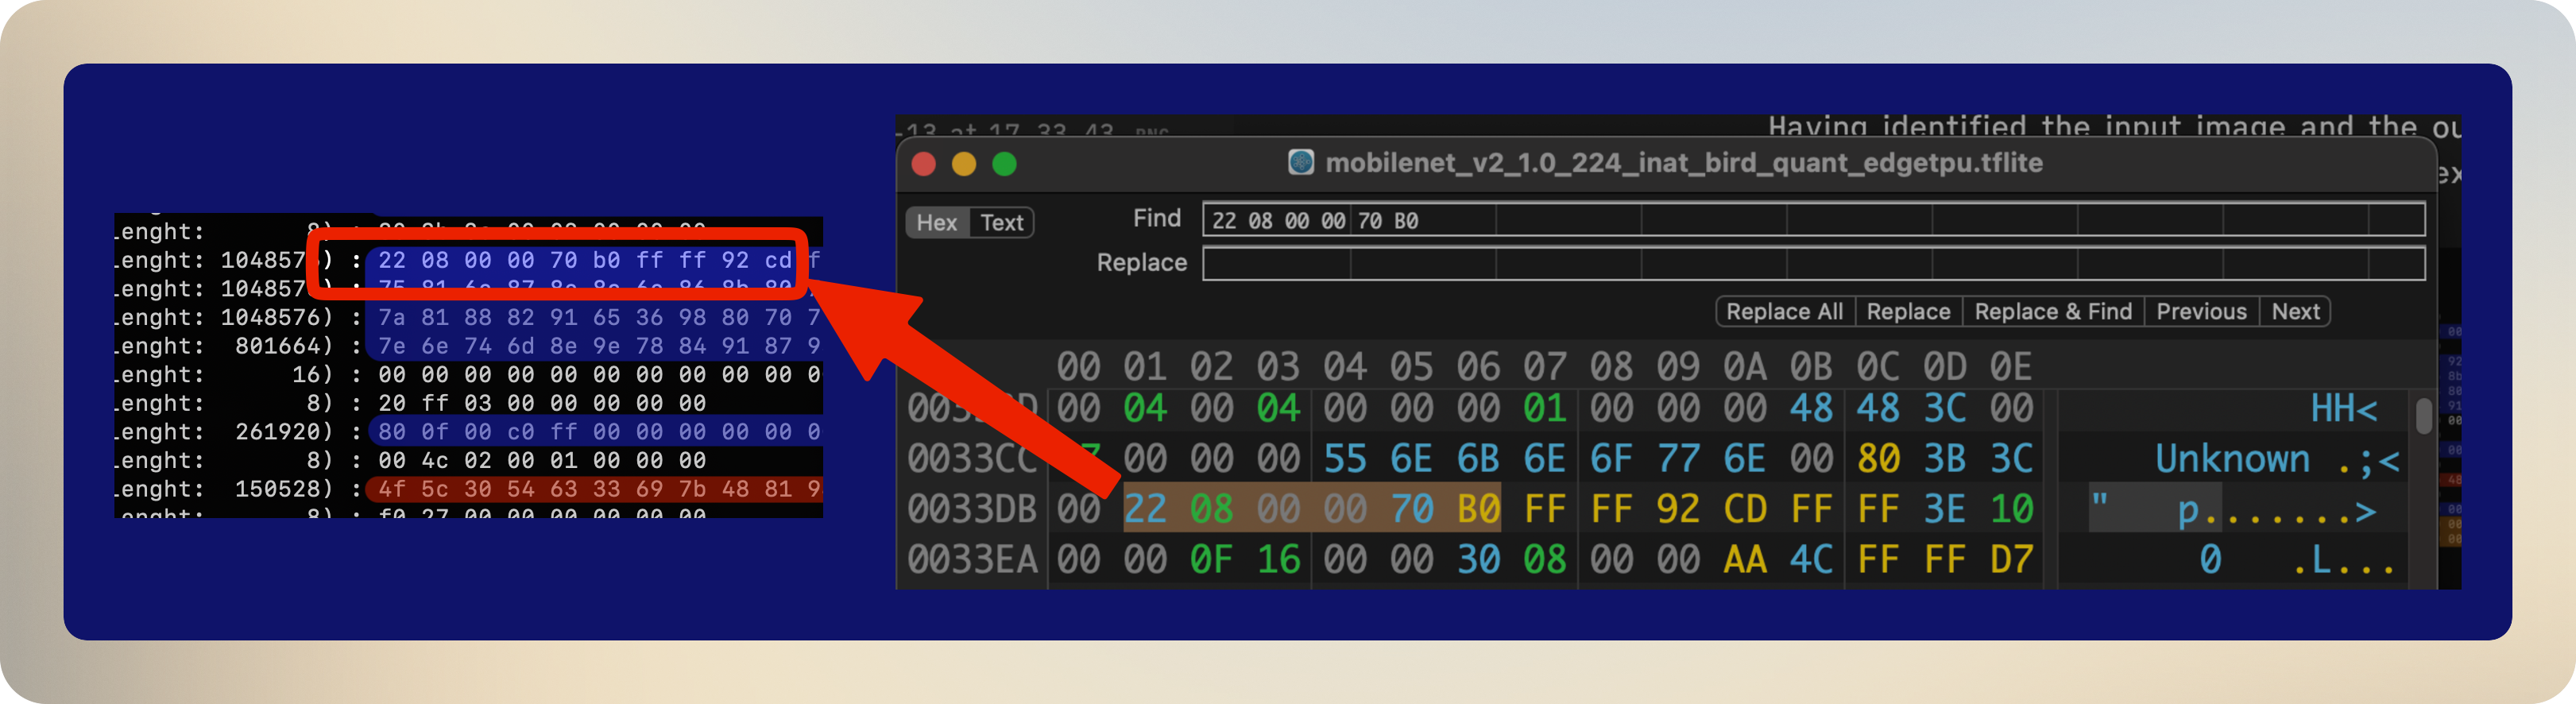
Quick search through the logs and we can see our first patterns:
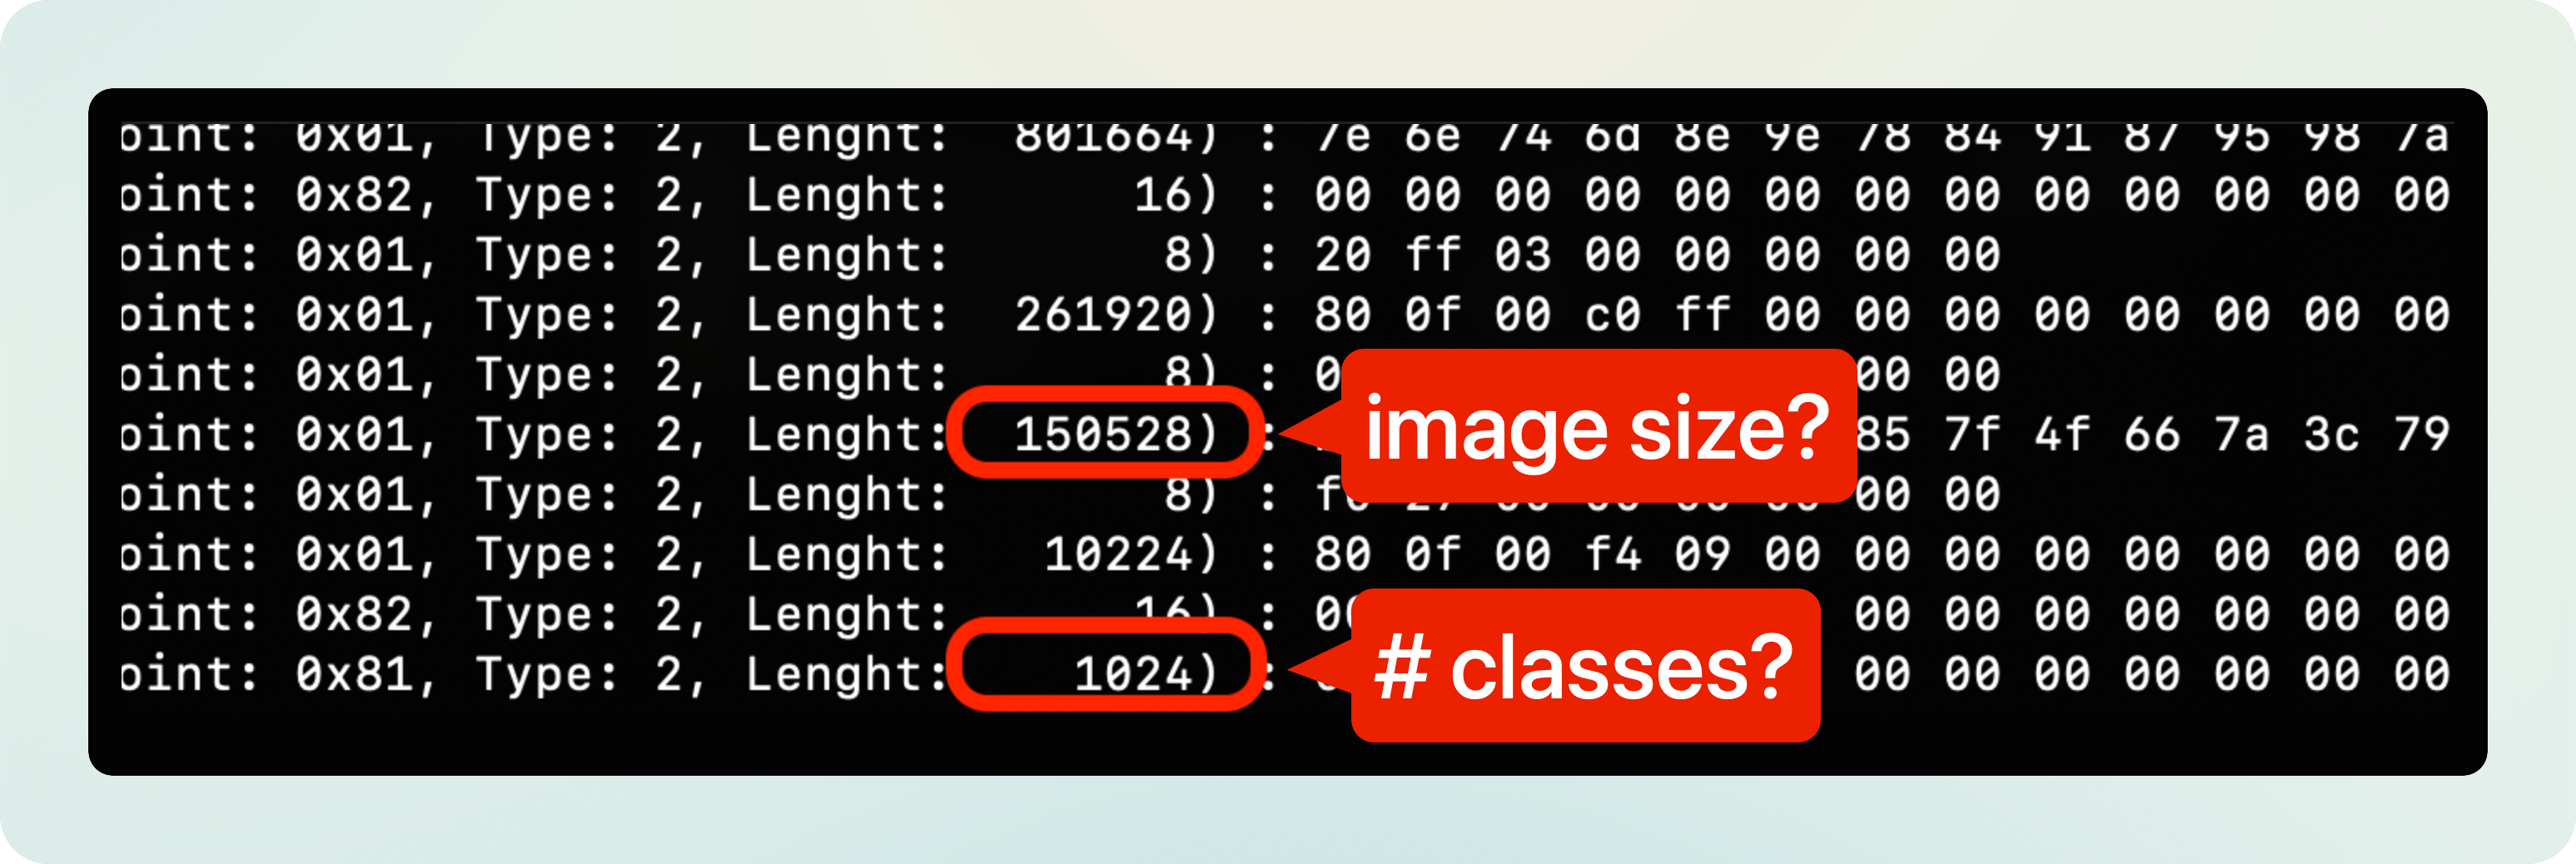
Those two transfers must correspond to the sent image and the received classification scores!
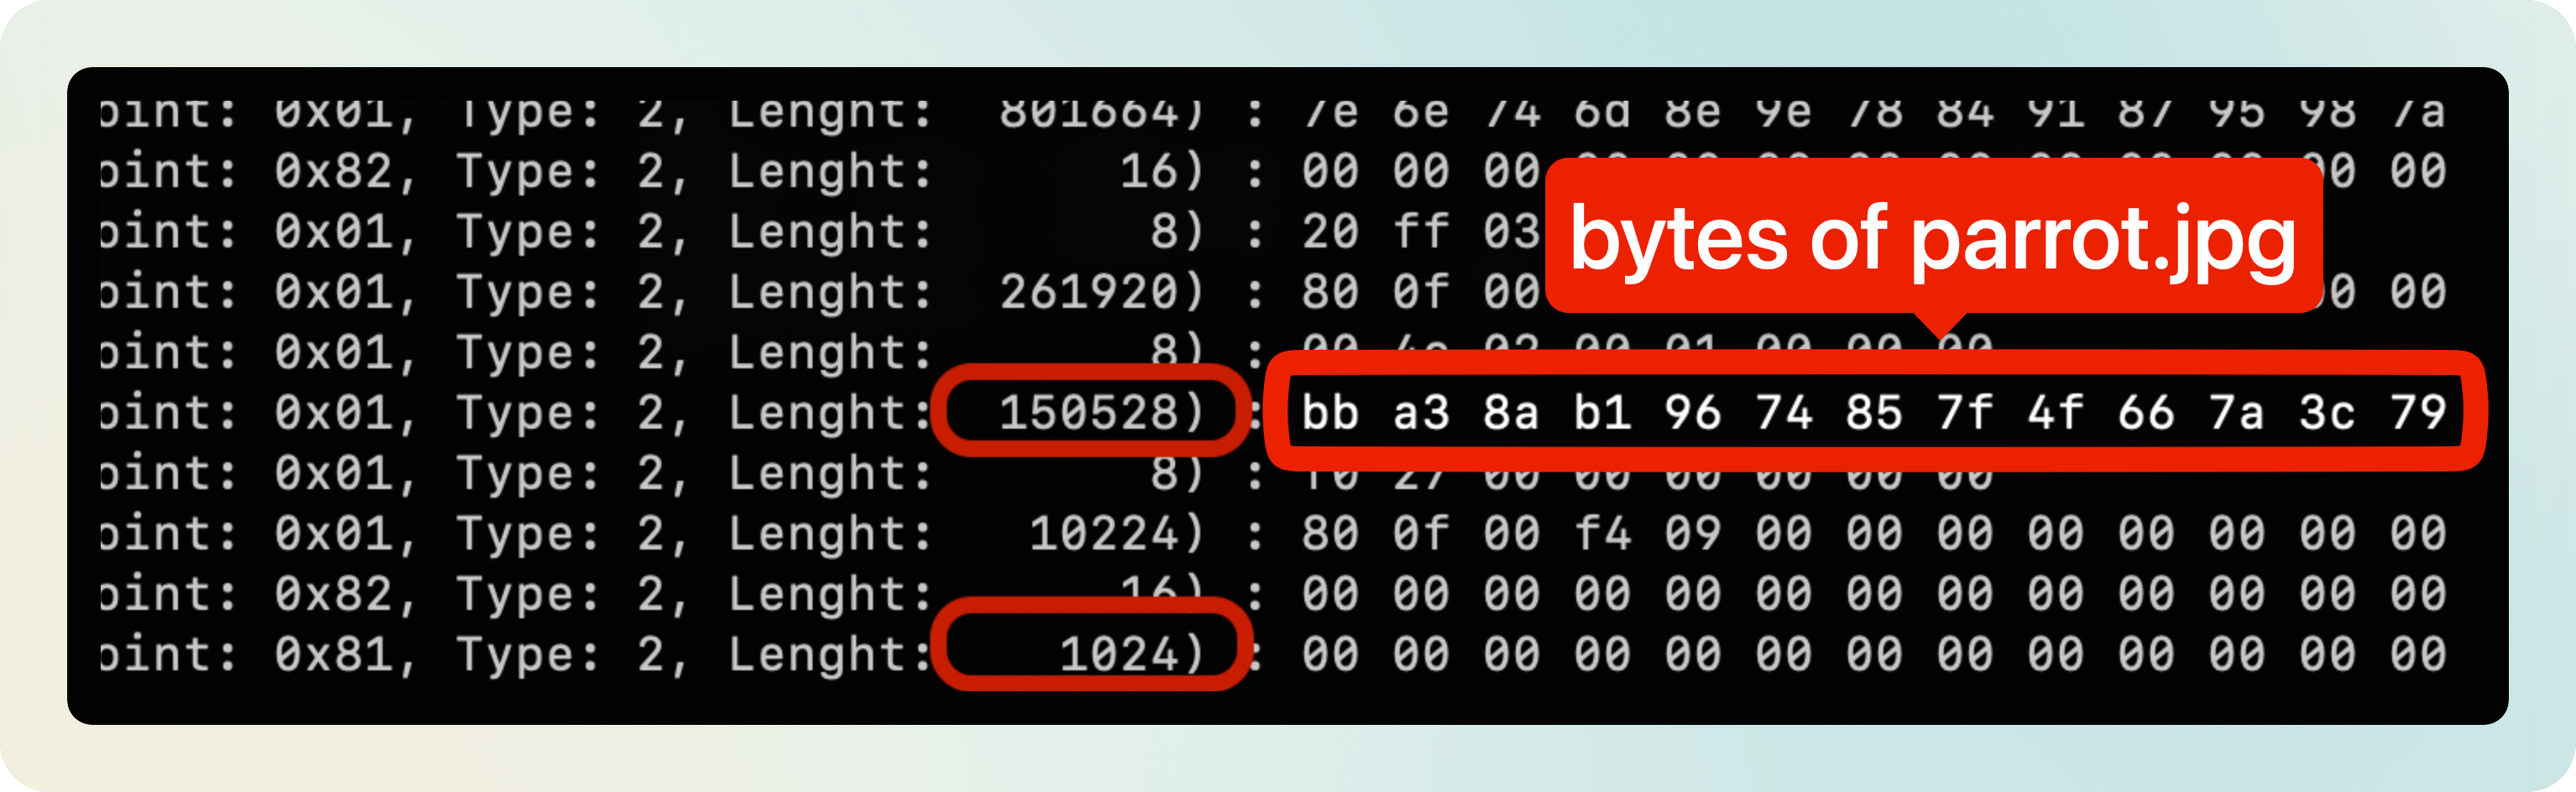
Let’s see if we can make sense of the actual bytes being transferred. I put together a simple script that resizes the image to (224x224) and prints its contents:
from PIL import Image

image = Image.open(path).convert('RGB').resize((224, 224))
image_bytes = image.tobytes()
hex_list = [f'{byte:02x}' for byte in image_bytes]

print(hex_list[0:10])
And this is what I get:
>> python get_hex_data.py parrot.jpg
    Input      : "test_data/parrot.jpg"
    Image size : 150528
    Hex data   : ['bb', 'a3', '89', 'b0', '97', '74', '86', '80', '50', '67']
See the hex data? It’s the bytes that we saw before!
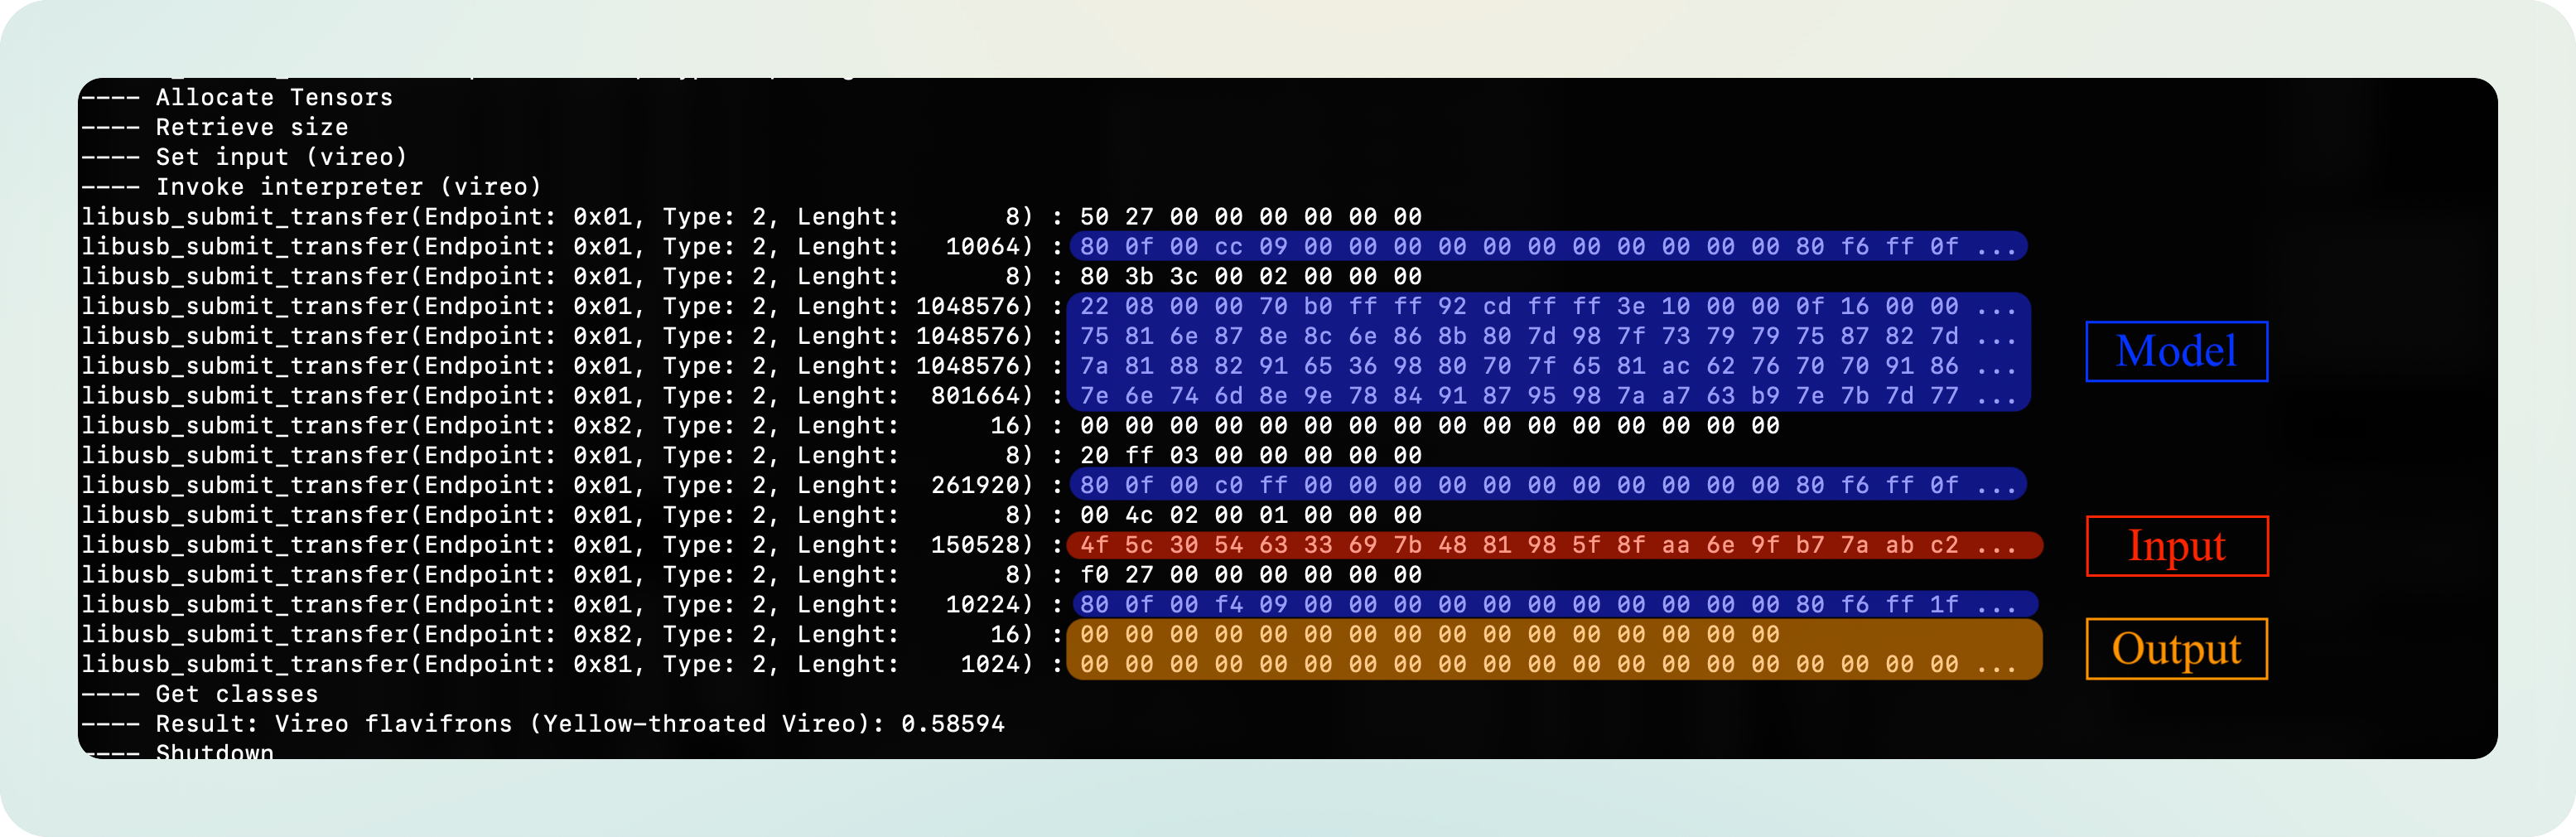
Having identified the input image and the output scores, what other key piece of information is there to identify? exactly, the model. It must be the big blob that’s being transmitted in 4 pieces:
How can we check that? We can see if the hexdump of the .tflite model contains the bytes that we have identified as model. Indeed, it does:
Note: Some mysteries remain: Why is only part of the model being transmitted? What’s the first line in the blue region corresponding to? I’ll have to live with that. Either way, since I’ll just mock the data, it’s not that important to figure it out.
Ok, so far so good.
Now, let’s zoom out again and try to make sense of the overall structure of the data being sent. I’ll run 1, 2 and 3 inferences:
python examples/classify_image.py \
--model test_data/mobilenet_v2_1.0_224_inat_bird_quant_edgetpu.tflite \
--labels test_data/inat_bird_labels.txt \
--input test_data/parrot.jpg \
--count 1  # 1, 2 and 3 inferences
This is what I see:
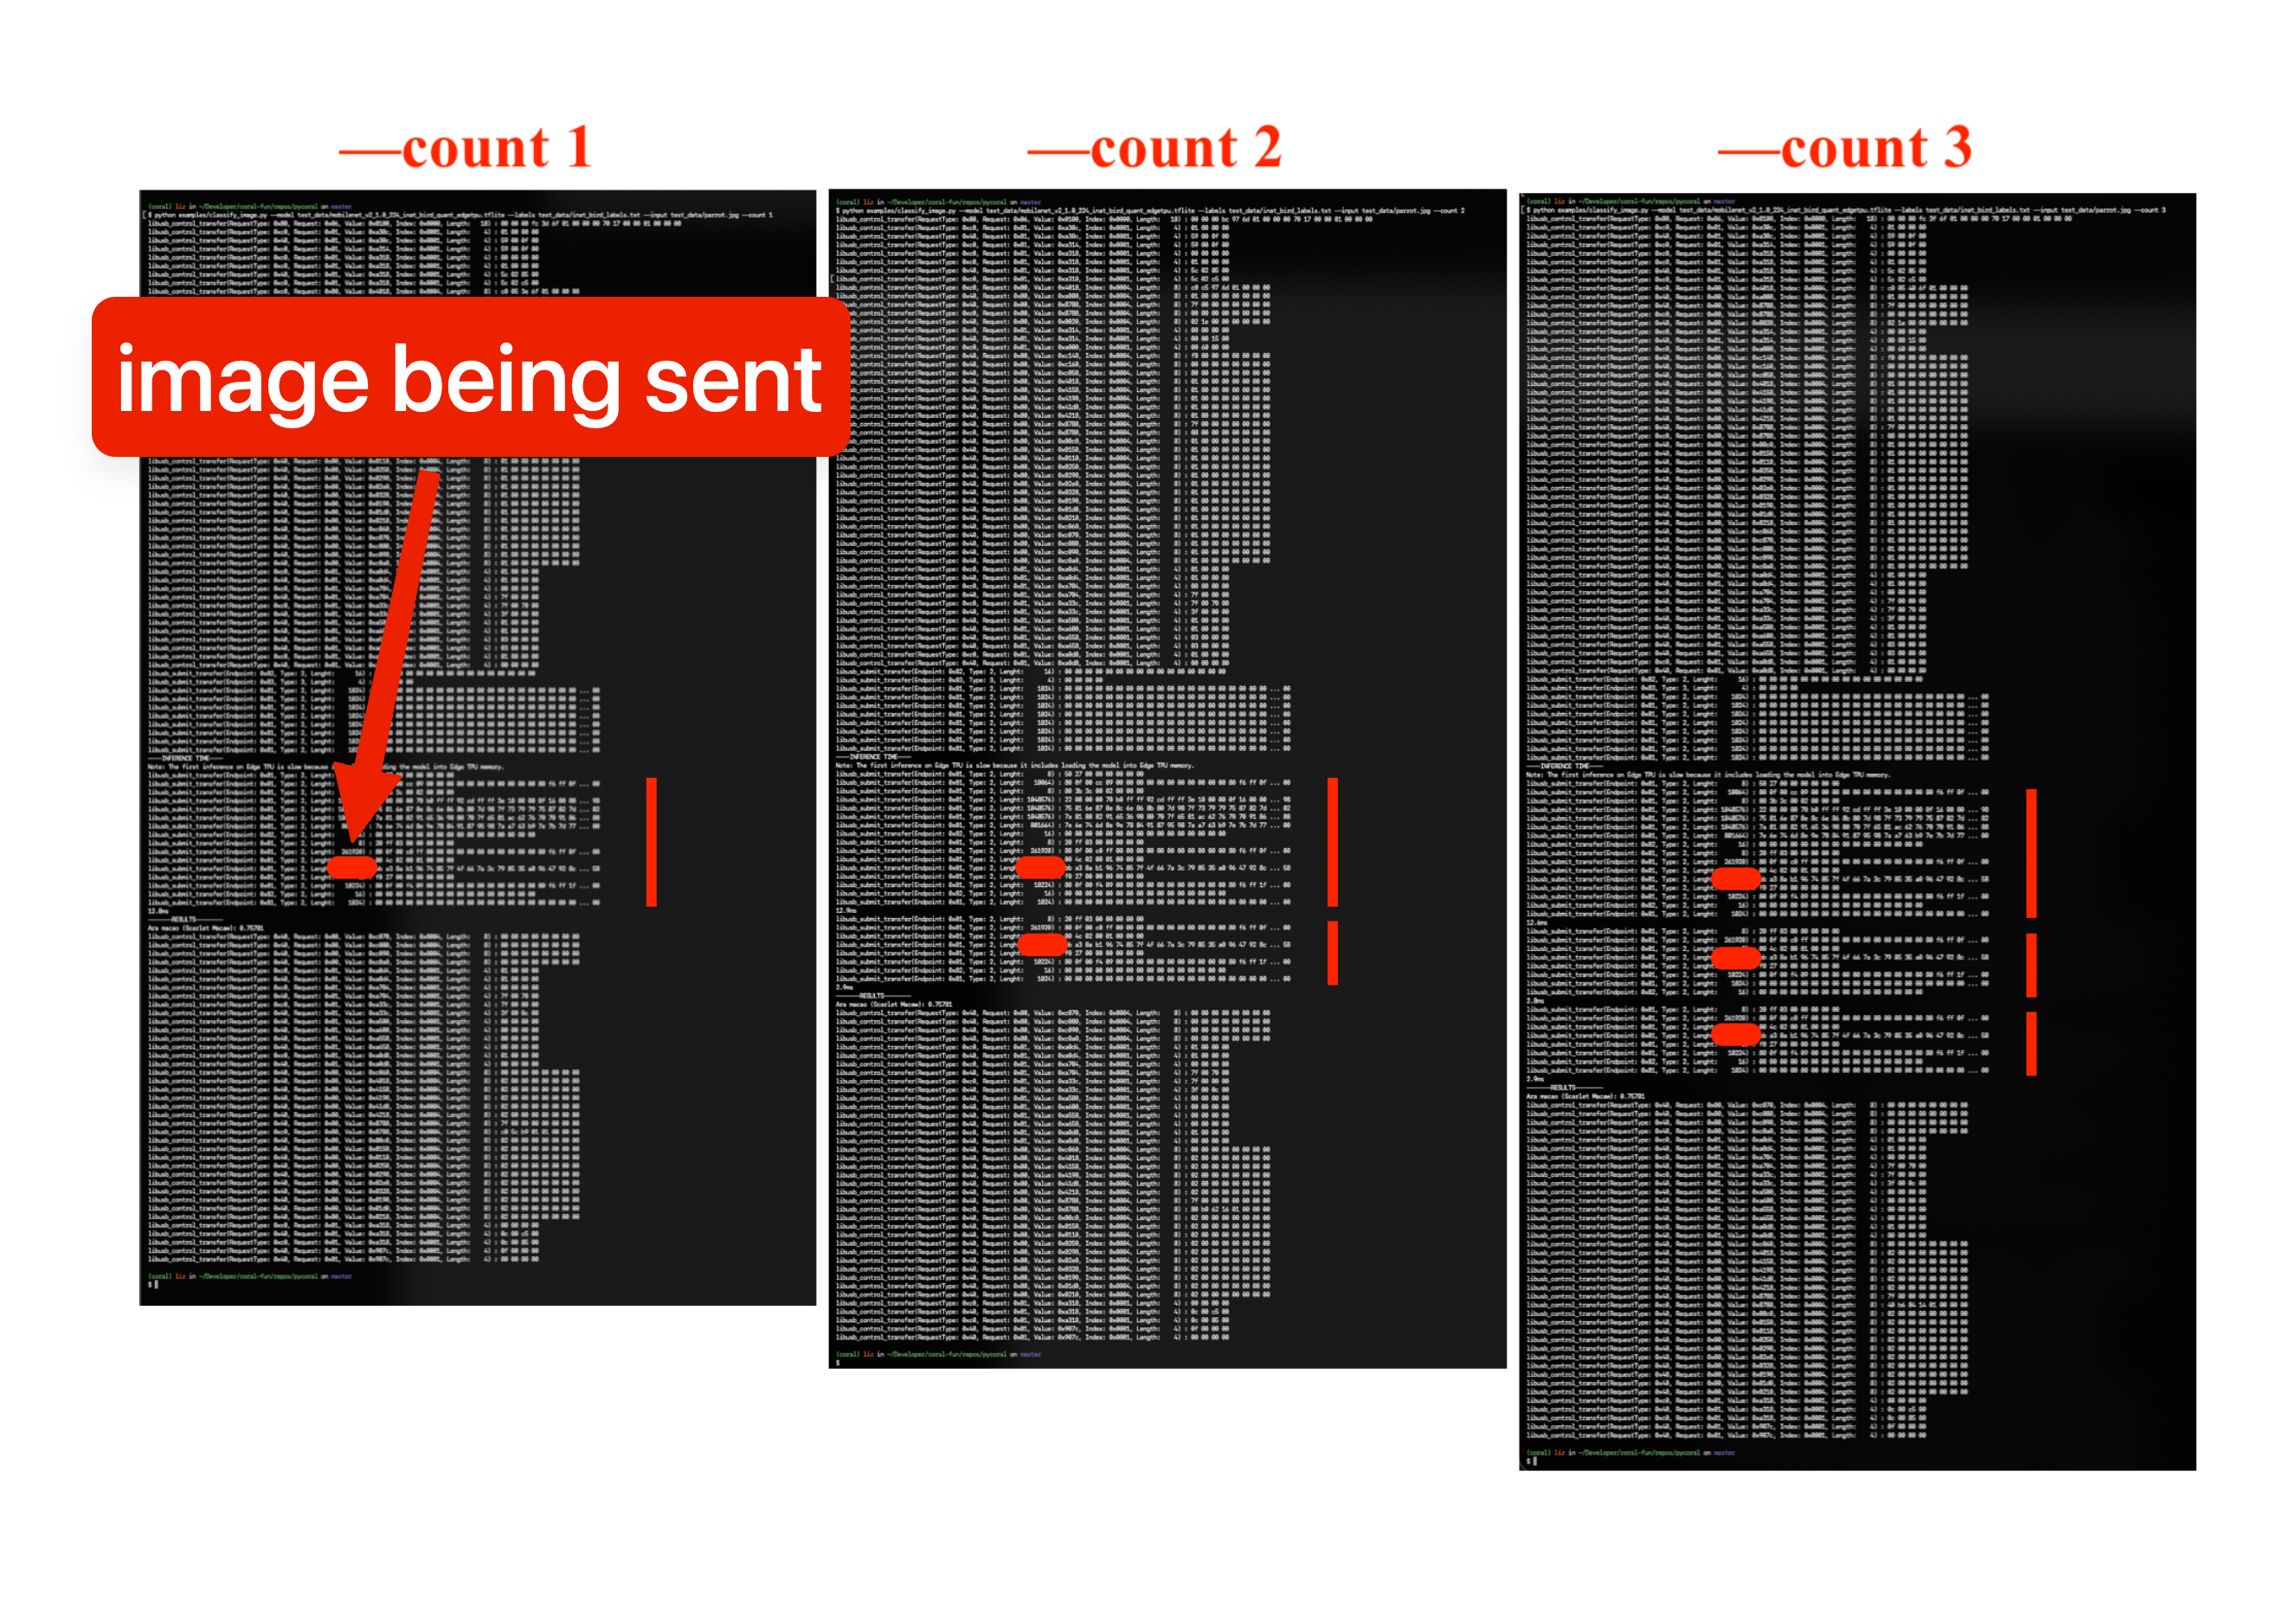
I’ve marked with the red blobs the point where the image is being sent.
Do you see it? There’s clearly a pattern: the image is sent as many times as inferences there are.
Besides that, there seems to be some constant structure happening before and after the transfer, seemingly some sort of setup and shutdown subroutines.
Notice also how the first inference call is longer, while subsequent ones are shorter. Why could that be?
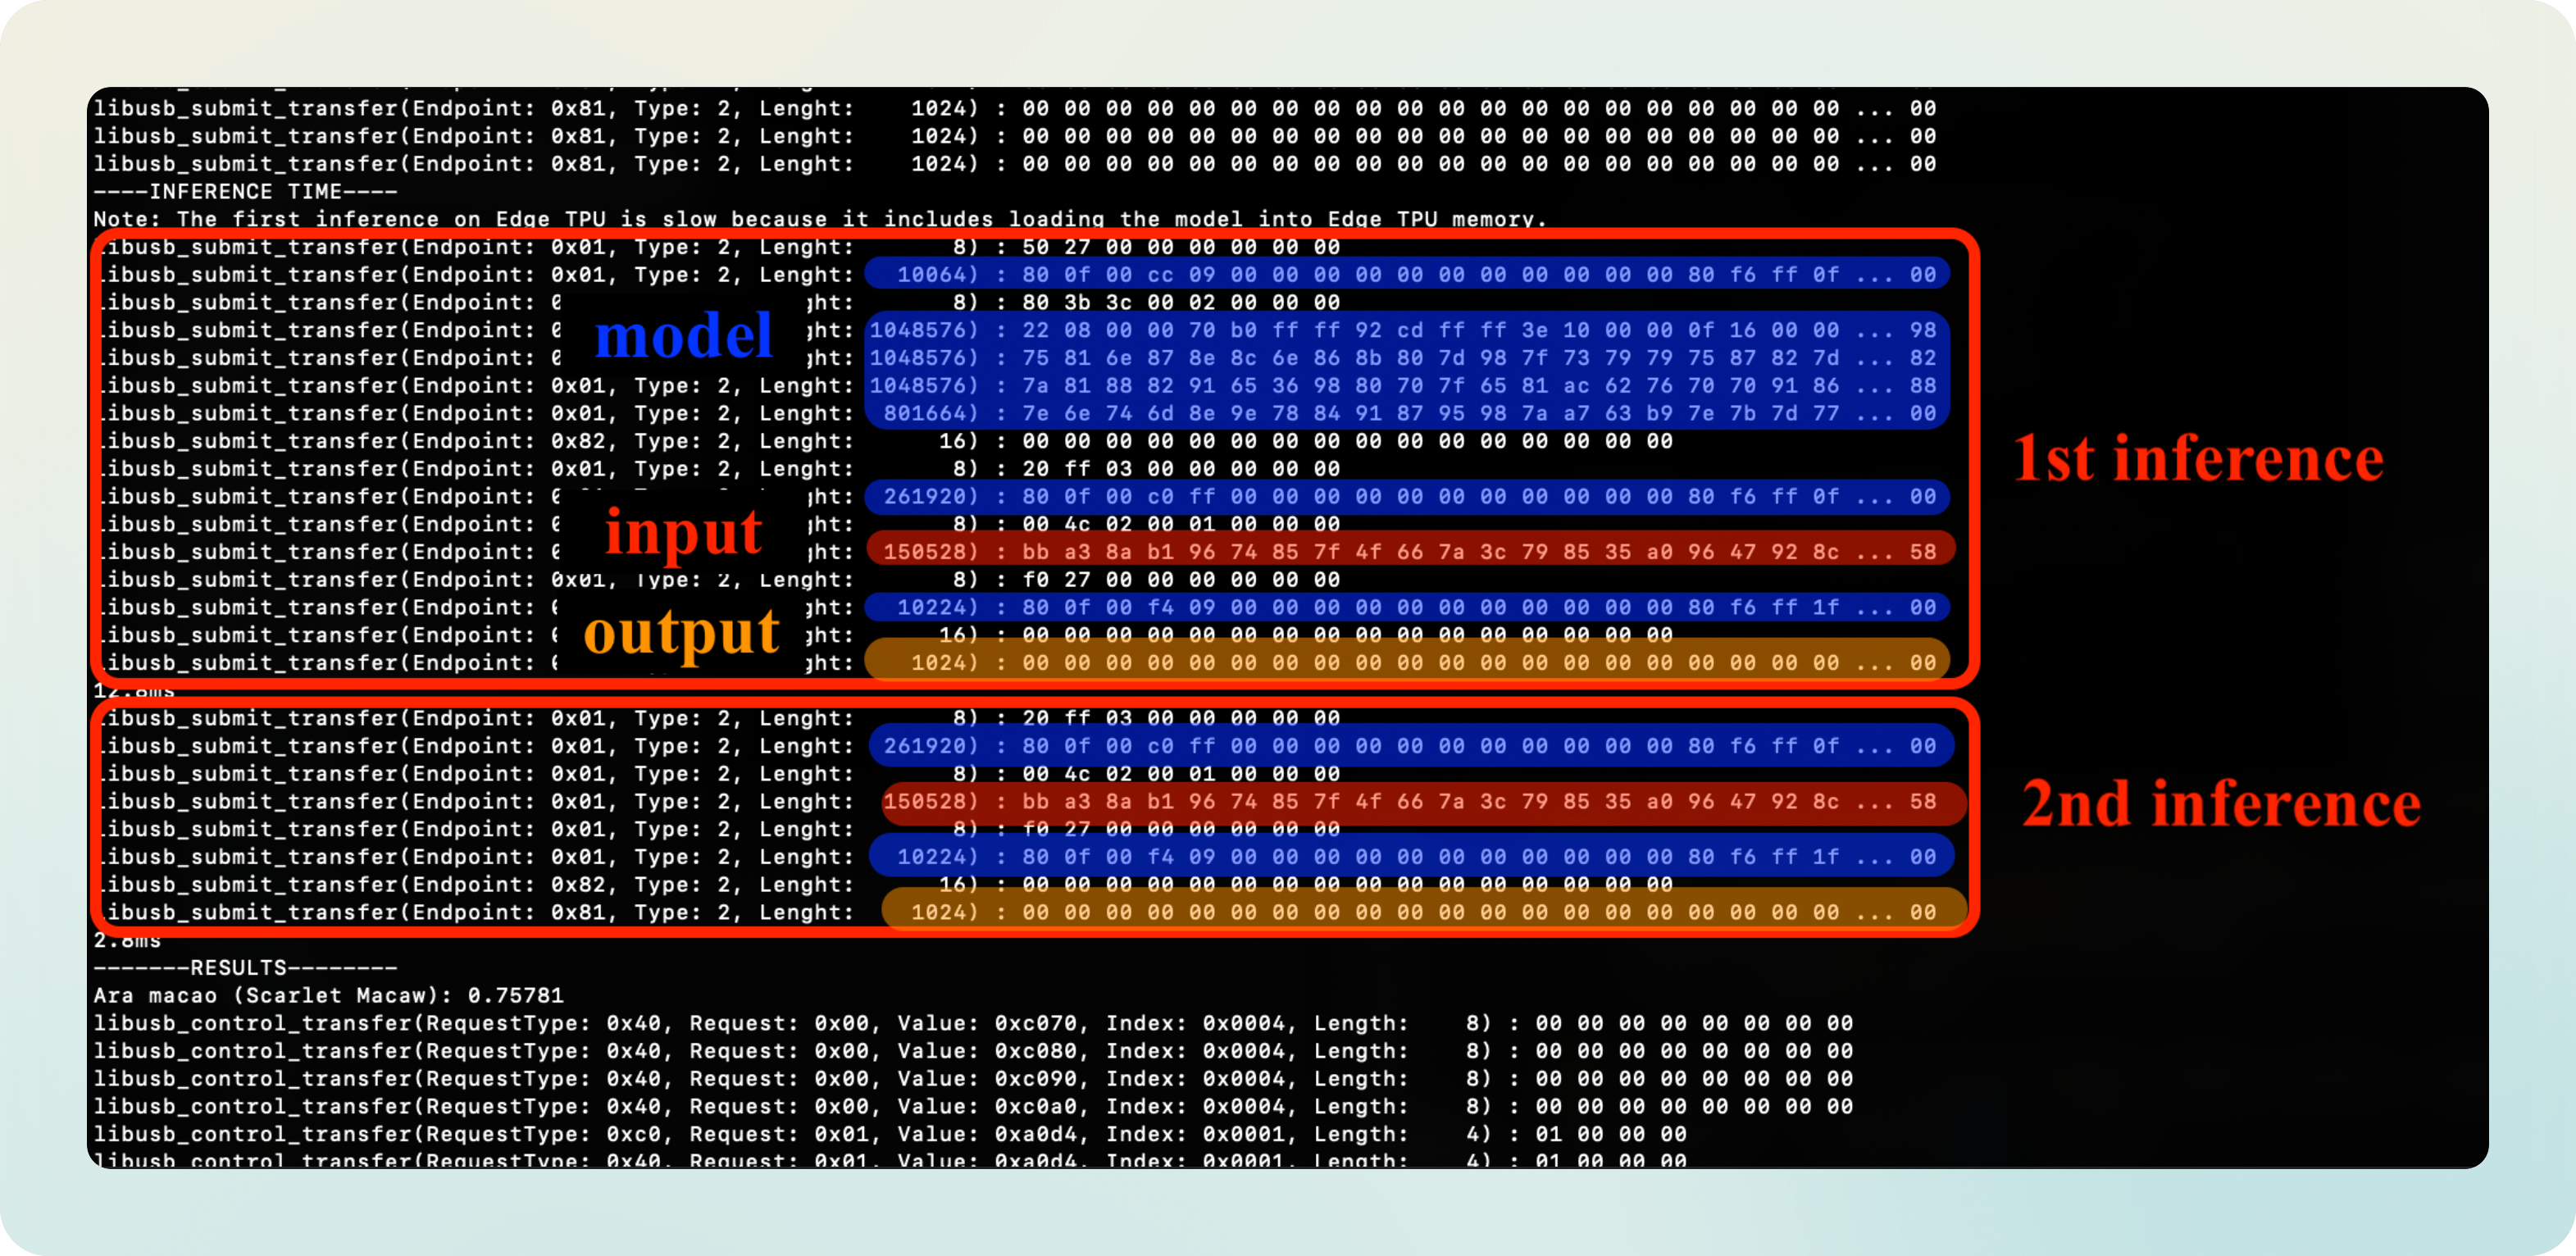
As the official docs say, the TPU caches the model on the first call to speed up subsequent inference calls:

That’s a pretty good overview of what’s going on! So far we have not looked into the details of each line, but we have a good high level overview.
Installing the firmware
There’s something I didn’t tell you yet: the TPU needs firmware to run, which is downloaded at runtime from the host (my PC).
You might have thought that the device comes with the firmware inside, already installed inside but that’s not the case. In fact, the firmware has to be sent to the TPU every time it’s reconnected to the host system.
Look at the following comparison of the USB data intercepted on the first inference vs. the second:

If you’re curious, you can take a look at this dump where I’ve collected the firmware being sent.
Ok, but why would the firmware need to be transferred on each run?
It seems that the TPU supports running in two modes:
- Single TPU inference
- Pipeline inference: several TPUs connected in series, each one running part of the model.
My guess is that each mode requires a different firmware, which is loaded at runtime.
Now, let’s make sense of the firmware. This is a closeup of it:
I was a bit lost at this point, I’m not going to lie. I didn’t know how to make sense of that data. I parked it on the side and went to explore a bit more.
Later on, while schrolling through the libedgetpu repo, I came accross a driver folder. Could that be the firmware?
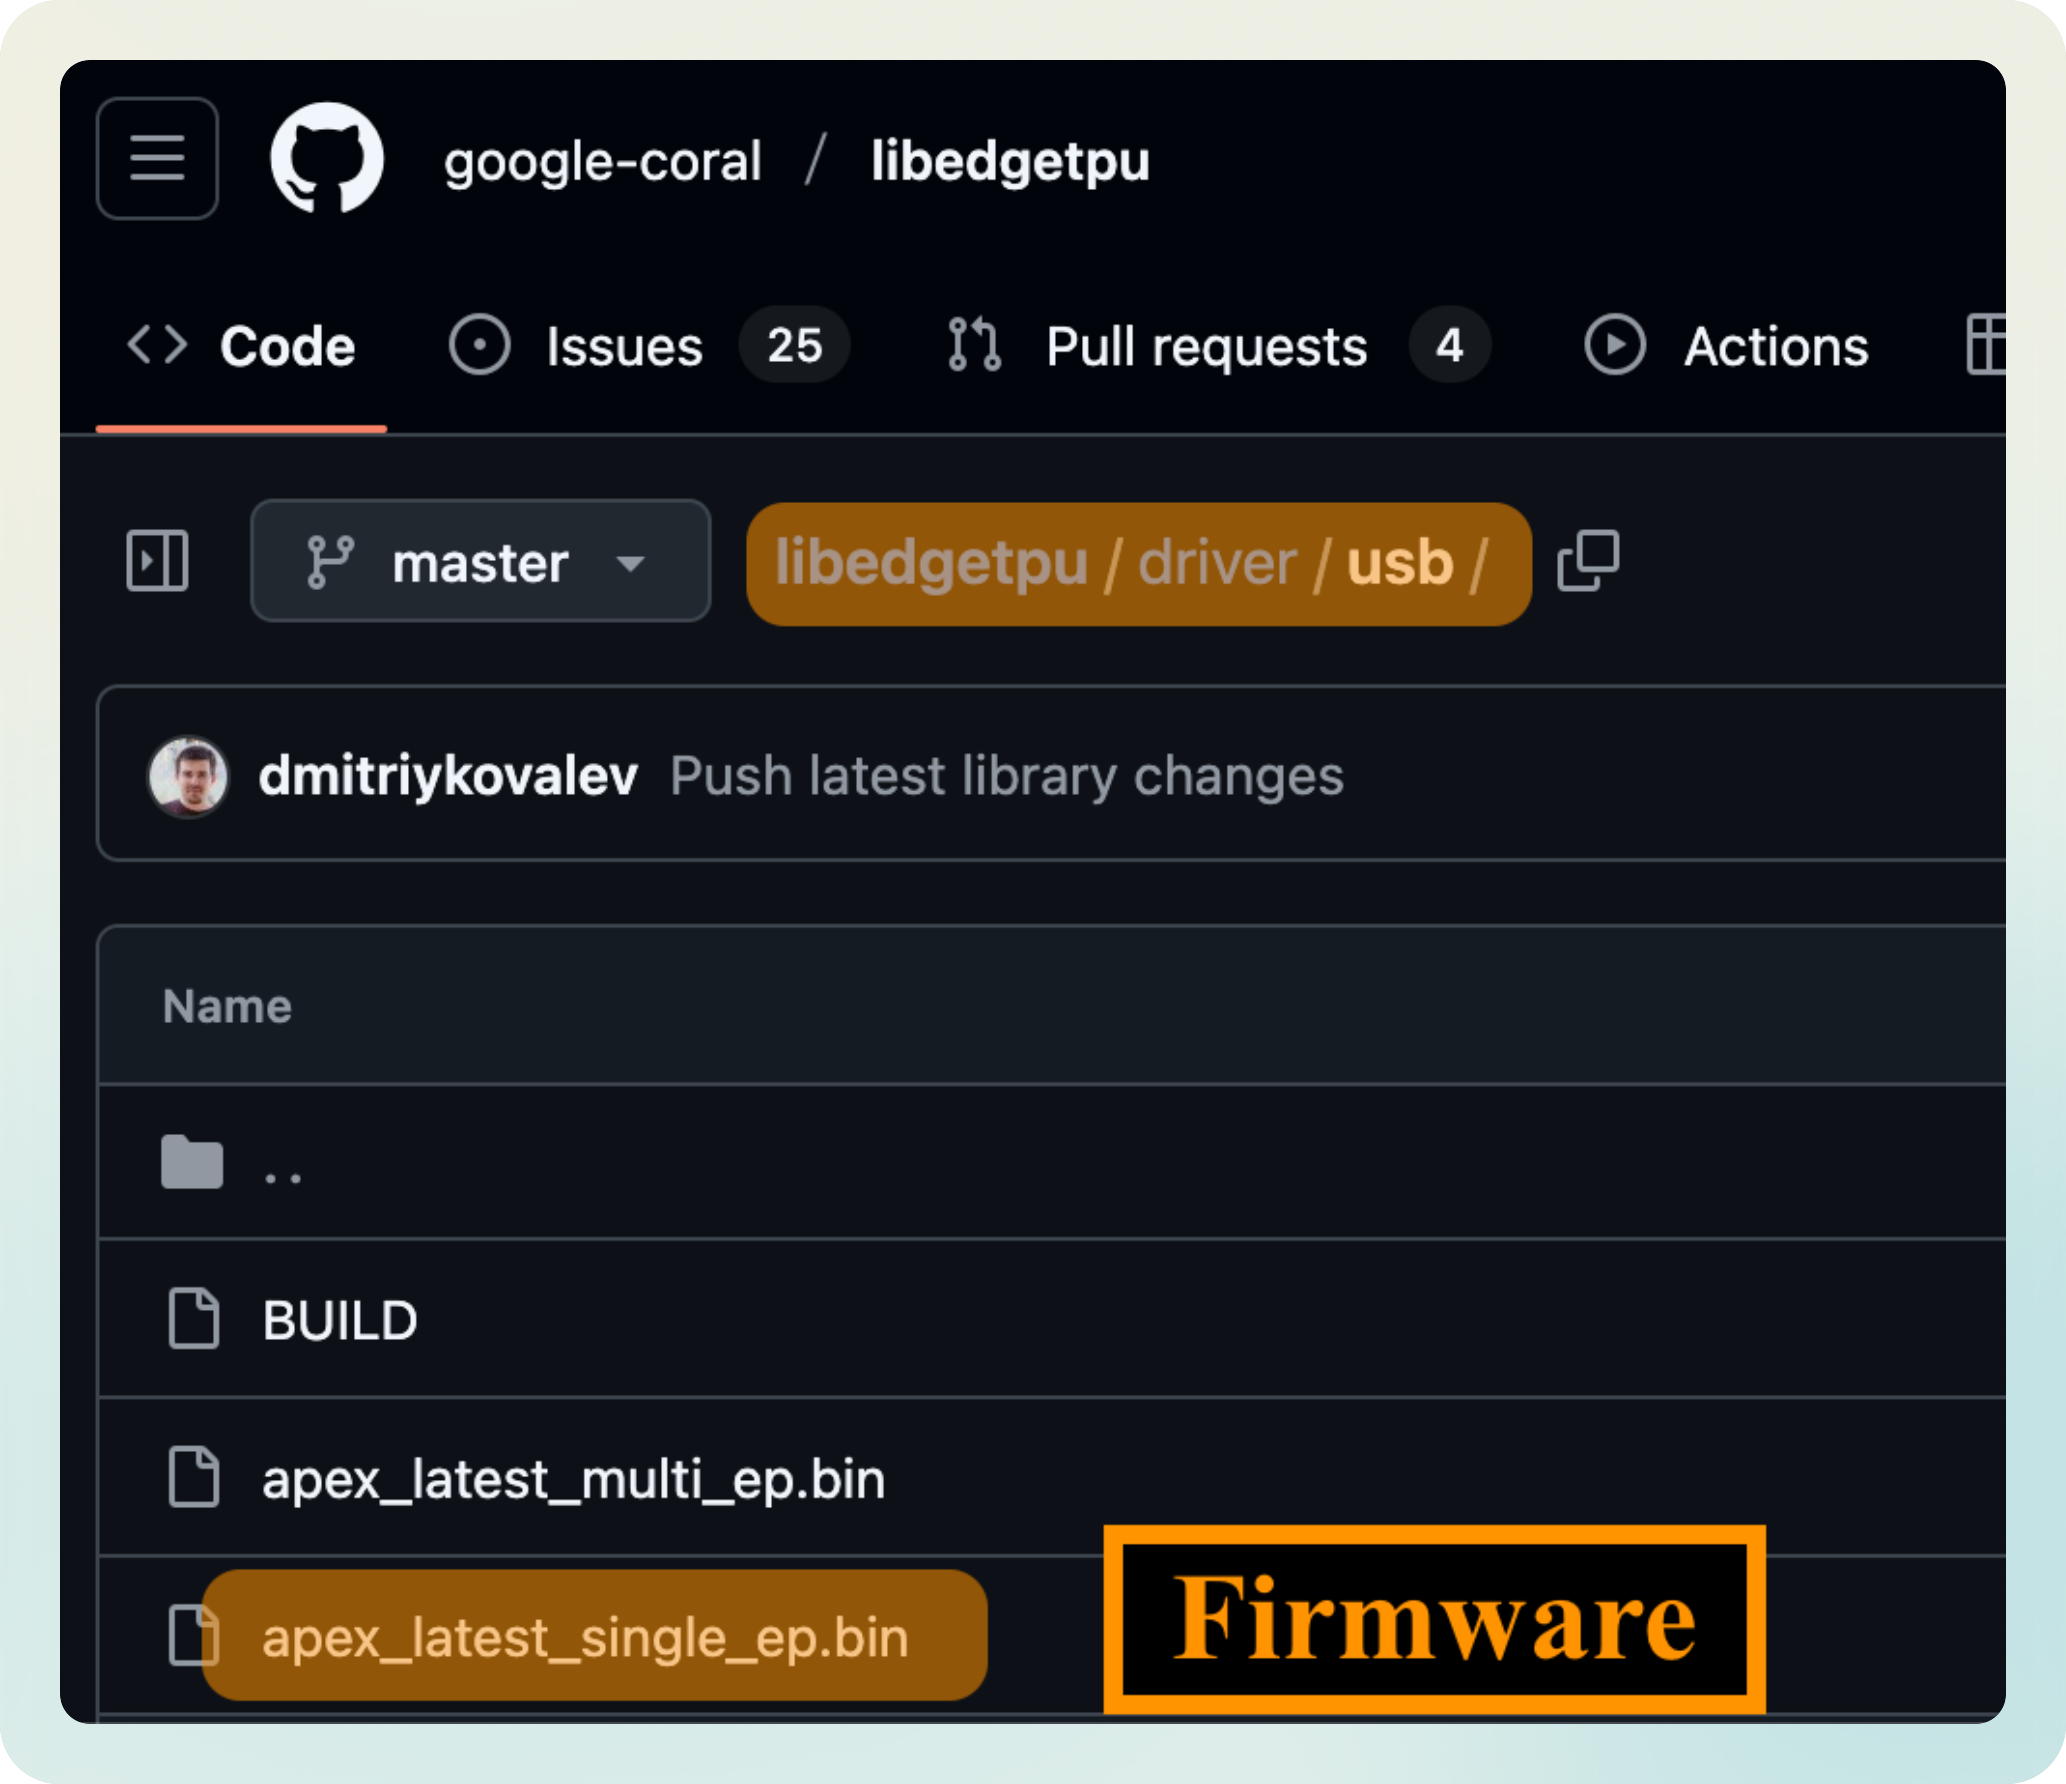
I picked apex_latest_single_ep.bin which I presumed was the firmware for the single TPU inference mode, opened it in my hex viewer, and there it was. The data I had seen before and could not make sense of:
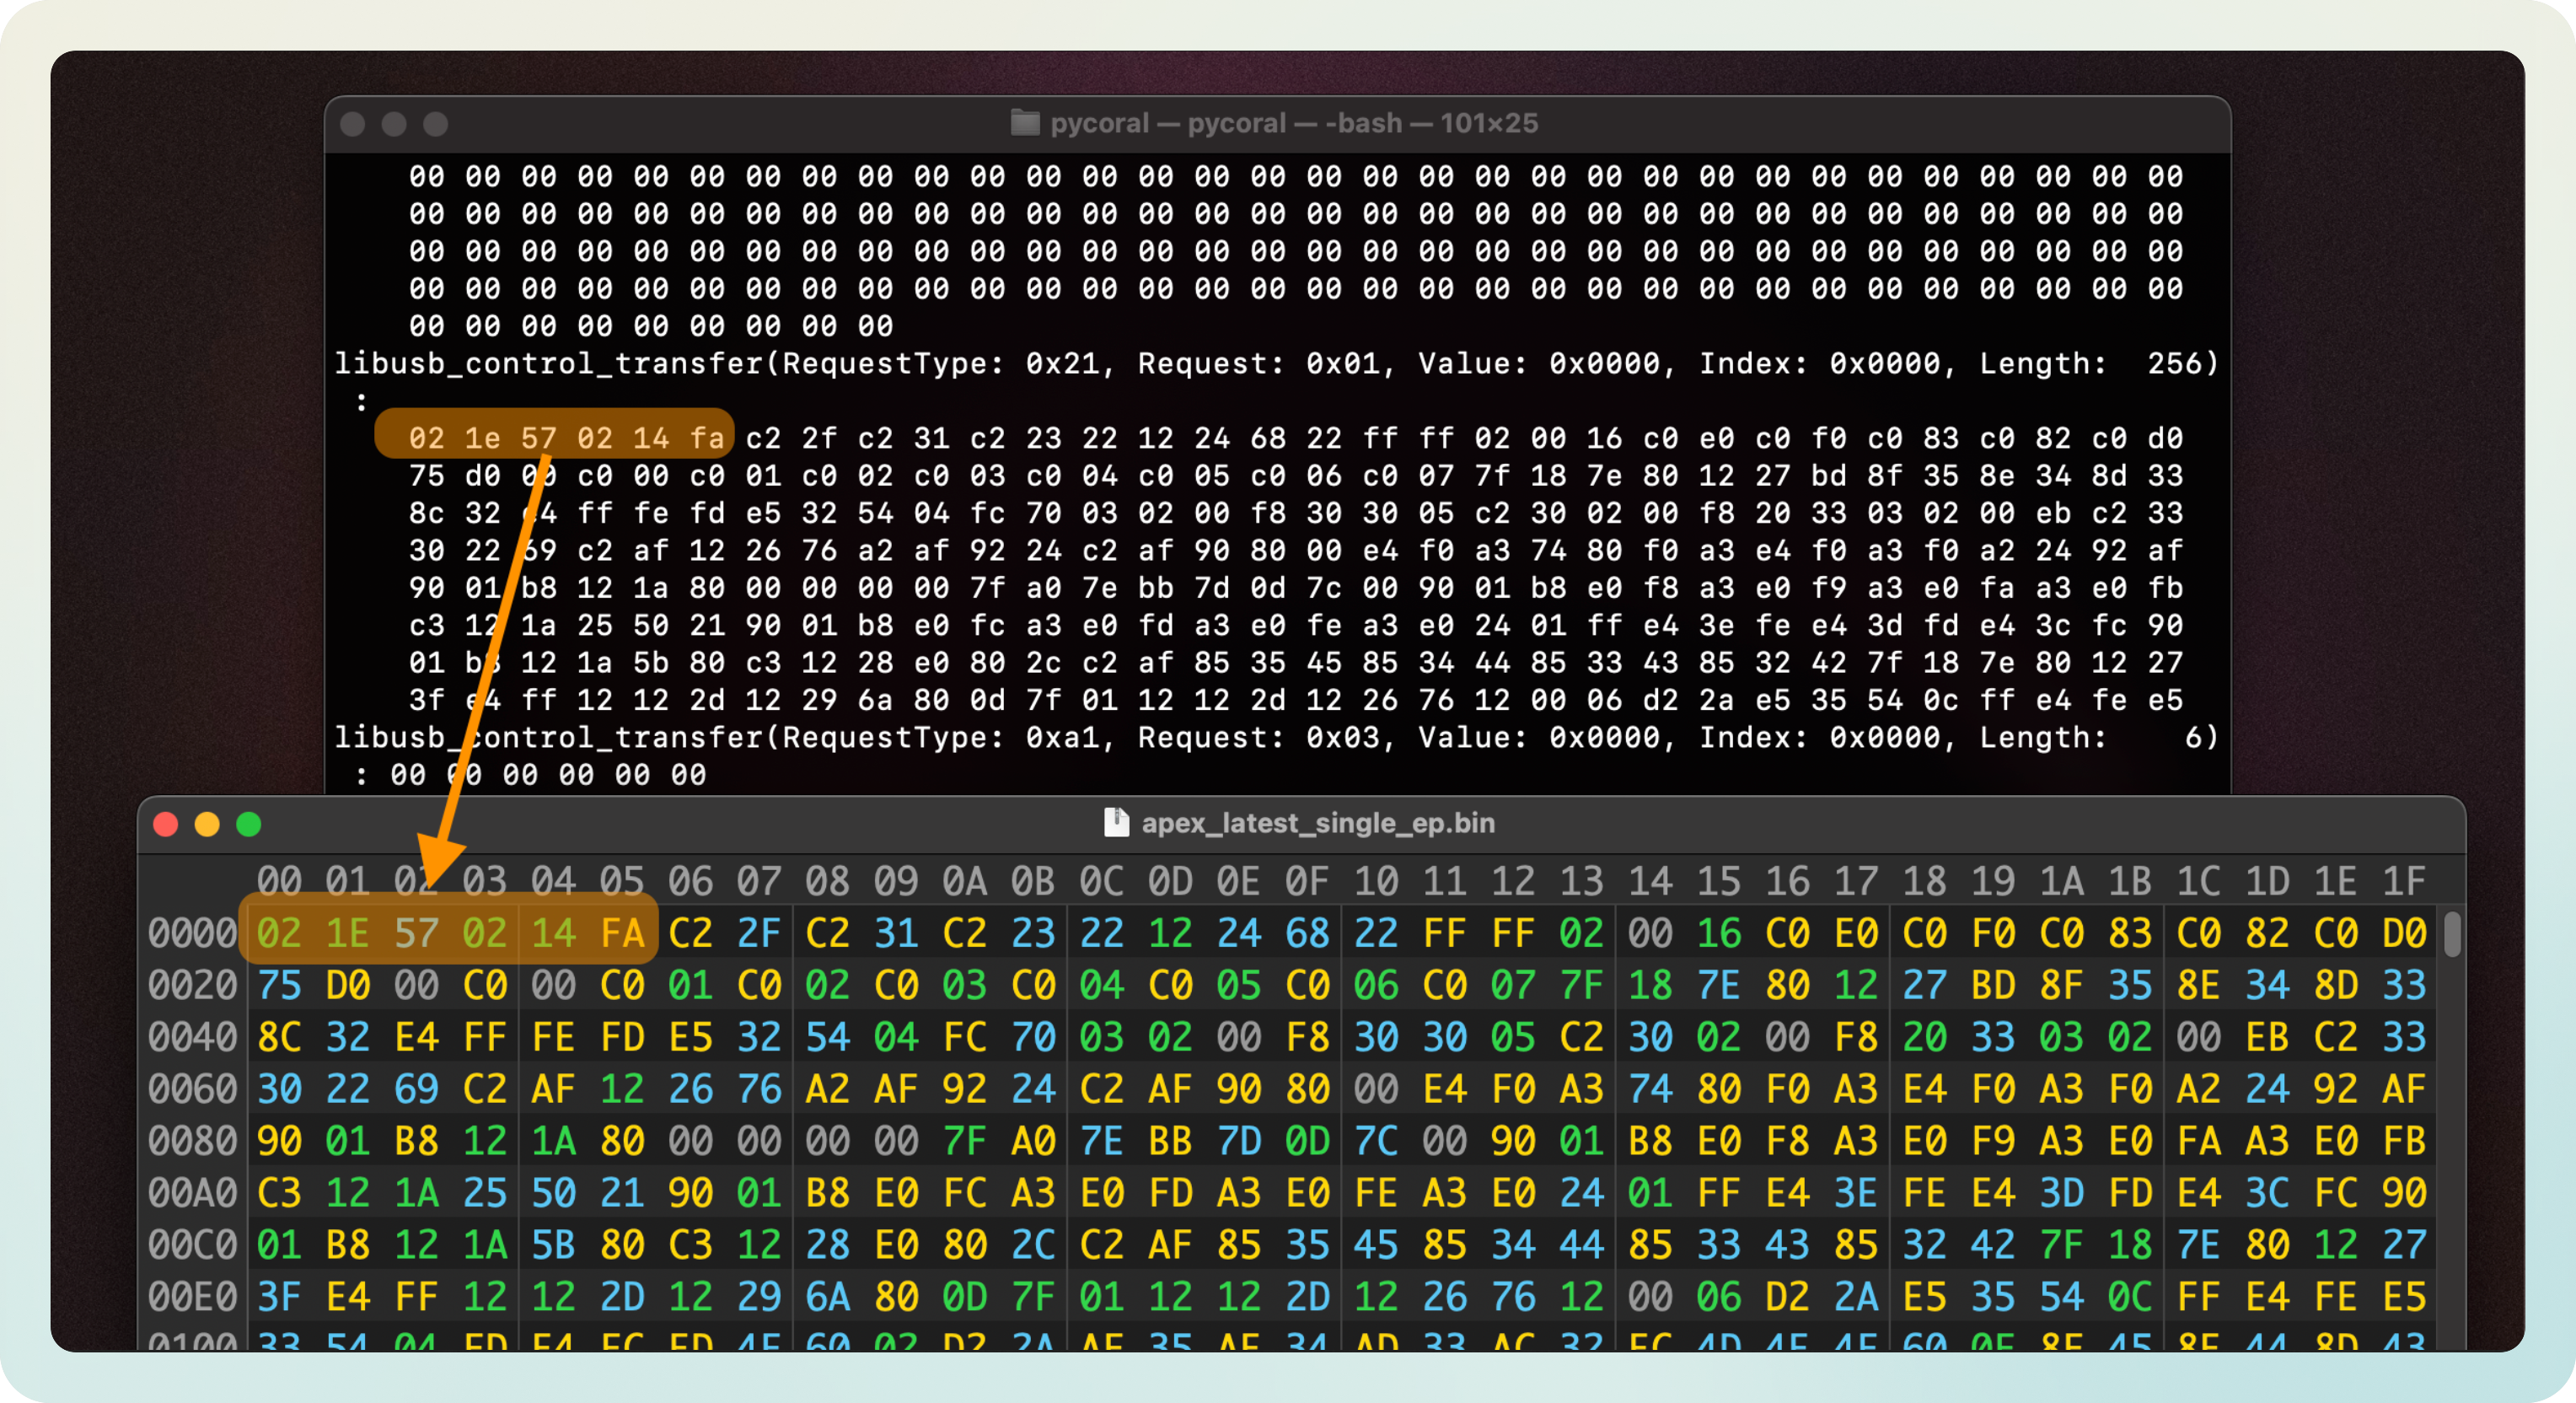
I added functionality to load apex_latest_single_ep.bin to the TPU. You can see it in the Github of the project.
Mocking the TPU driver
Now that we understand the structure of the USB communication that runs an inference on the TPU, we can mock it artificially. We need to:
- Install firmware
- Send USB data corresponding to Setup and Inference.
- Redout response.
I found out that not sending the Shutdown data was not critical, so I don’t do it.
Now, you might be wondering, how do we readout the data?
Reading the classification scores
When I inspected the data logs, I had seen the trace of a blob of 1024 bytes being transmitted. I hypotesised that those were the classification scores.
How can we read the classification scores and make sense of them?
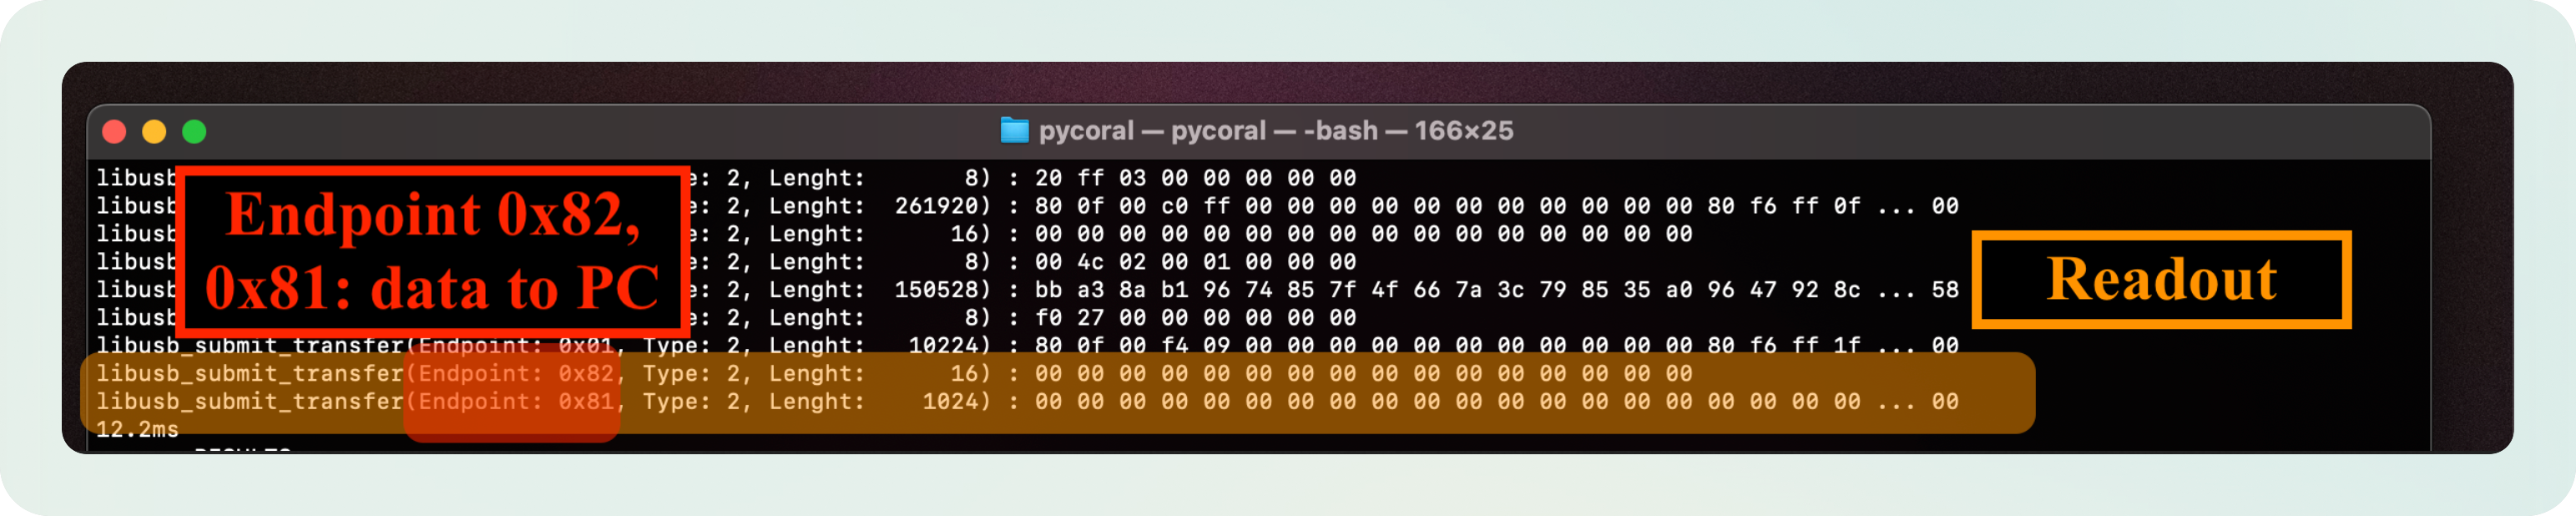
The data is sent throught endpoints 0x81 and 0x82 which are used for Device --> Host communication. That is the final confirmation of the data being the TPU’s reply.
Note: About endpoints and flow of data in the USB protocol:
- Endpoint
0x01meansHost --> Devicedata flow (e.g. the input image)- Endpoint
0x81or0x82meansDevice --> Hostdata flow (e.g. the outputs from the model)How do I know?
import usb.core # Vendor and Product ID found using lsusb device = usb.core.find(idVendor=0x18d1, idProduct=0x9302) print(device)(...) ENDPOINT 0x1: Bulk OUT =============================== bLength : 0x7 (7 bytes) bDescriptorType : 0x5 Endpoint bEndpointAddress : 0x1 OUT bmAttributes : 0x2 Bulk wMaxPacketSize : 0x400 (1024 bytes) bInterval : 0x0 (...) ENDPOINT 0x81: Bulk IN =============================== bLength : 0x7 (7 bytes) bDescriptorType : 0x5 Endpoint bEndpointAddress : 0x81 IN bmAttributes : 0x2 Bulk wMaxPacketSize : 0x400 (1024 bytes) bInterval : 0x0 (...)
To read the classification scores, I just have to request a read operation after sending the model and inference image. The full script implementing this can be seen in my Github > inference.py.
# 1. Send model
# 2. Send image
rsp1 = dev.read(0x82, 16)
activations = dev.read(0x81, 1024)
# Process data
I don’t know what the first 16 bytes are. But the next 1024 bytes encode the inference results. Let’s understand how:
Interpreting the output
I’m going to use a picture of coffee for inference.
These are the results I get using the official classification script from the Coral docs:
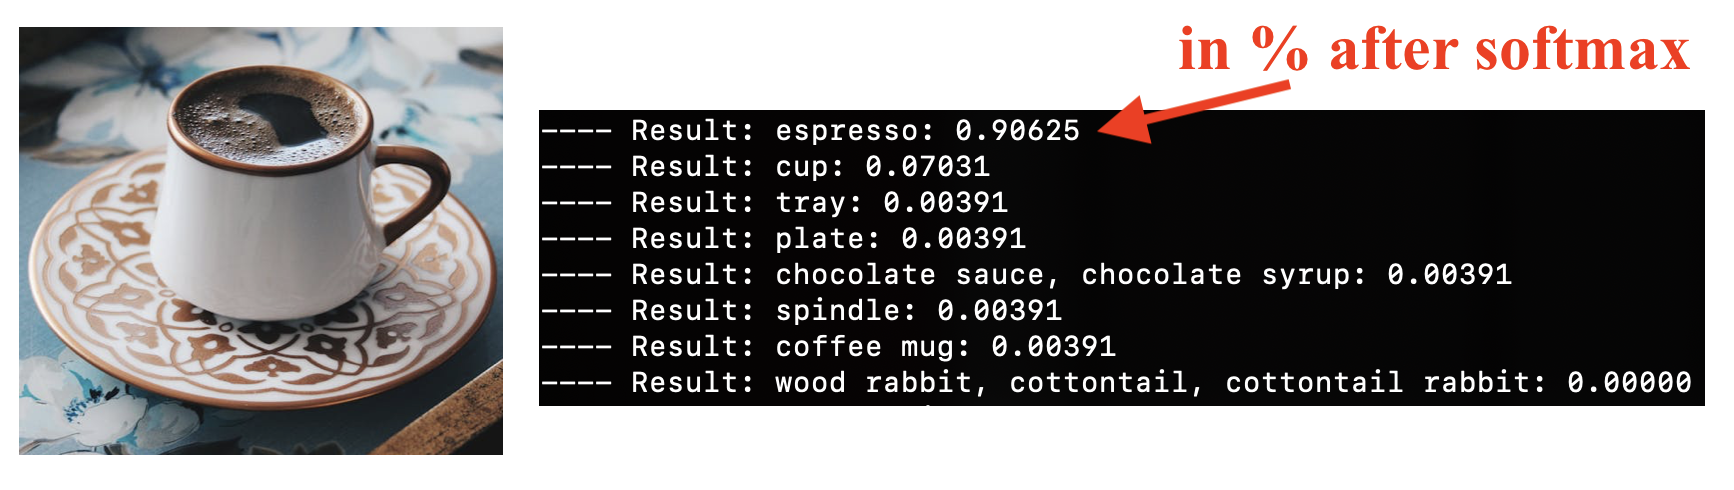
Can I extract the same classification scores from the raw USB data?
Below is the hexdump of 1024 bytes I received from the TPU:
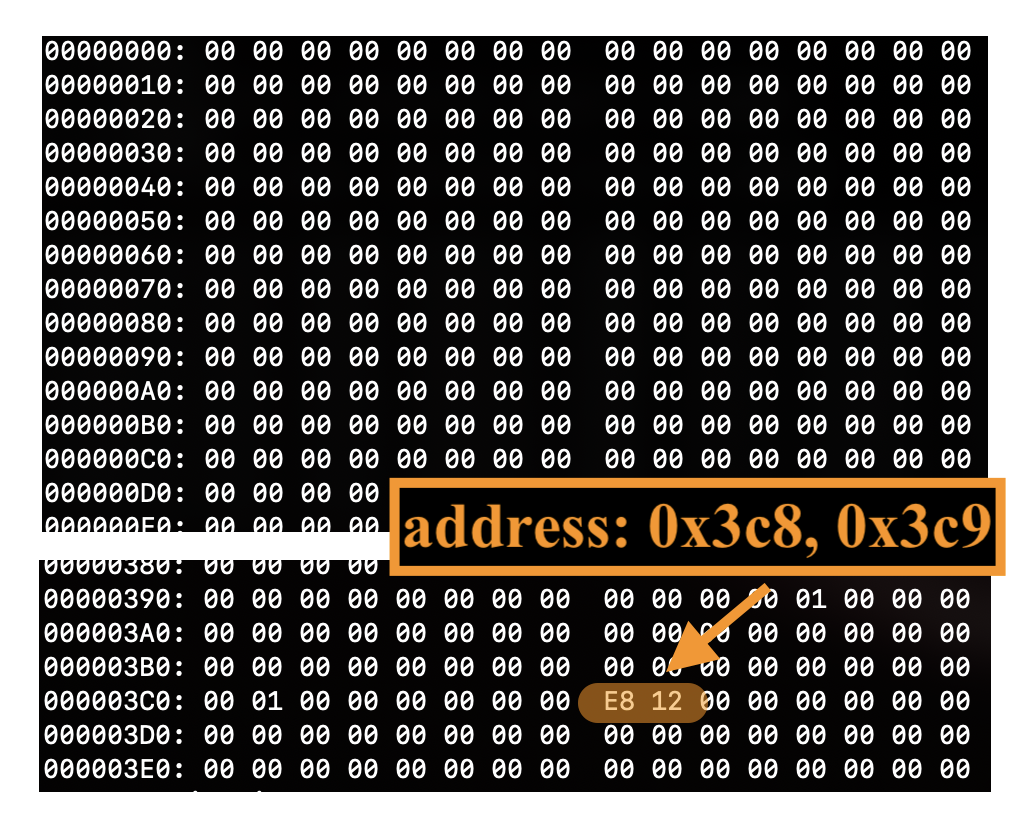
In the beginning, nothing interesting. But towards the end, there are two bytes that stand out:
- Address
0x3c8–> Data:0xe8 - Address
0x3c9–> Data:0x12
If you look closely, you’ll see other positions with values 0x01. Those are mainly residual values.
It makes sense to supposse that each address corresponds to a class, and that the data is the actual classification score. Remember that we had 1024 positions?
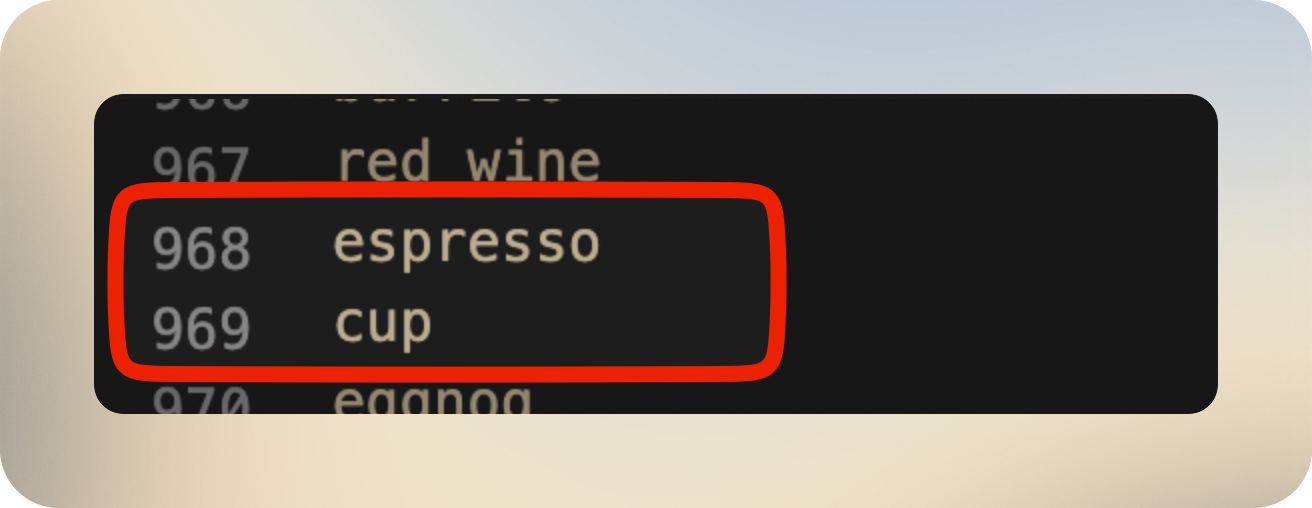
- Address
0x3c8->968 - Address
0x3c9->969
And if we look in the imagenet_labelt.txt, what are labels 968 and 969?
What about the values?
- Data
0xe8–>232 - Data
0x12–>18
How to map integer values to floating point classification scores? That calls for some quantization.
If we dig into the .tflite model file using Netron, we can see the output has some quantization applied:
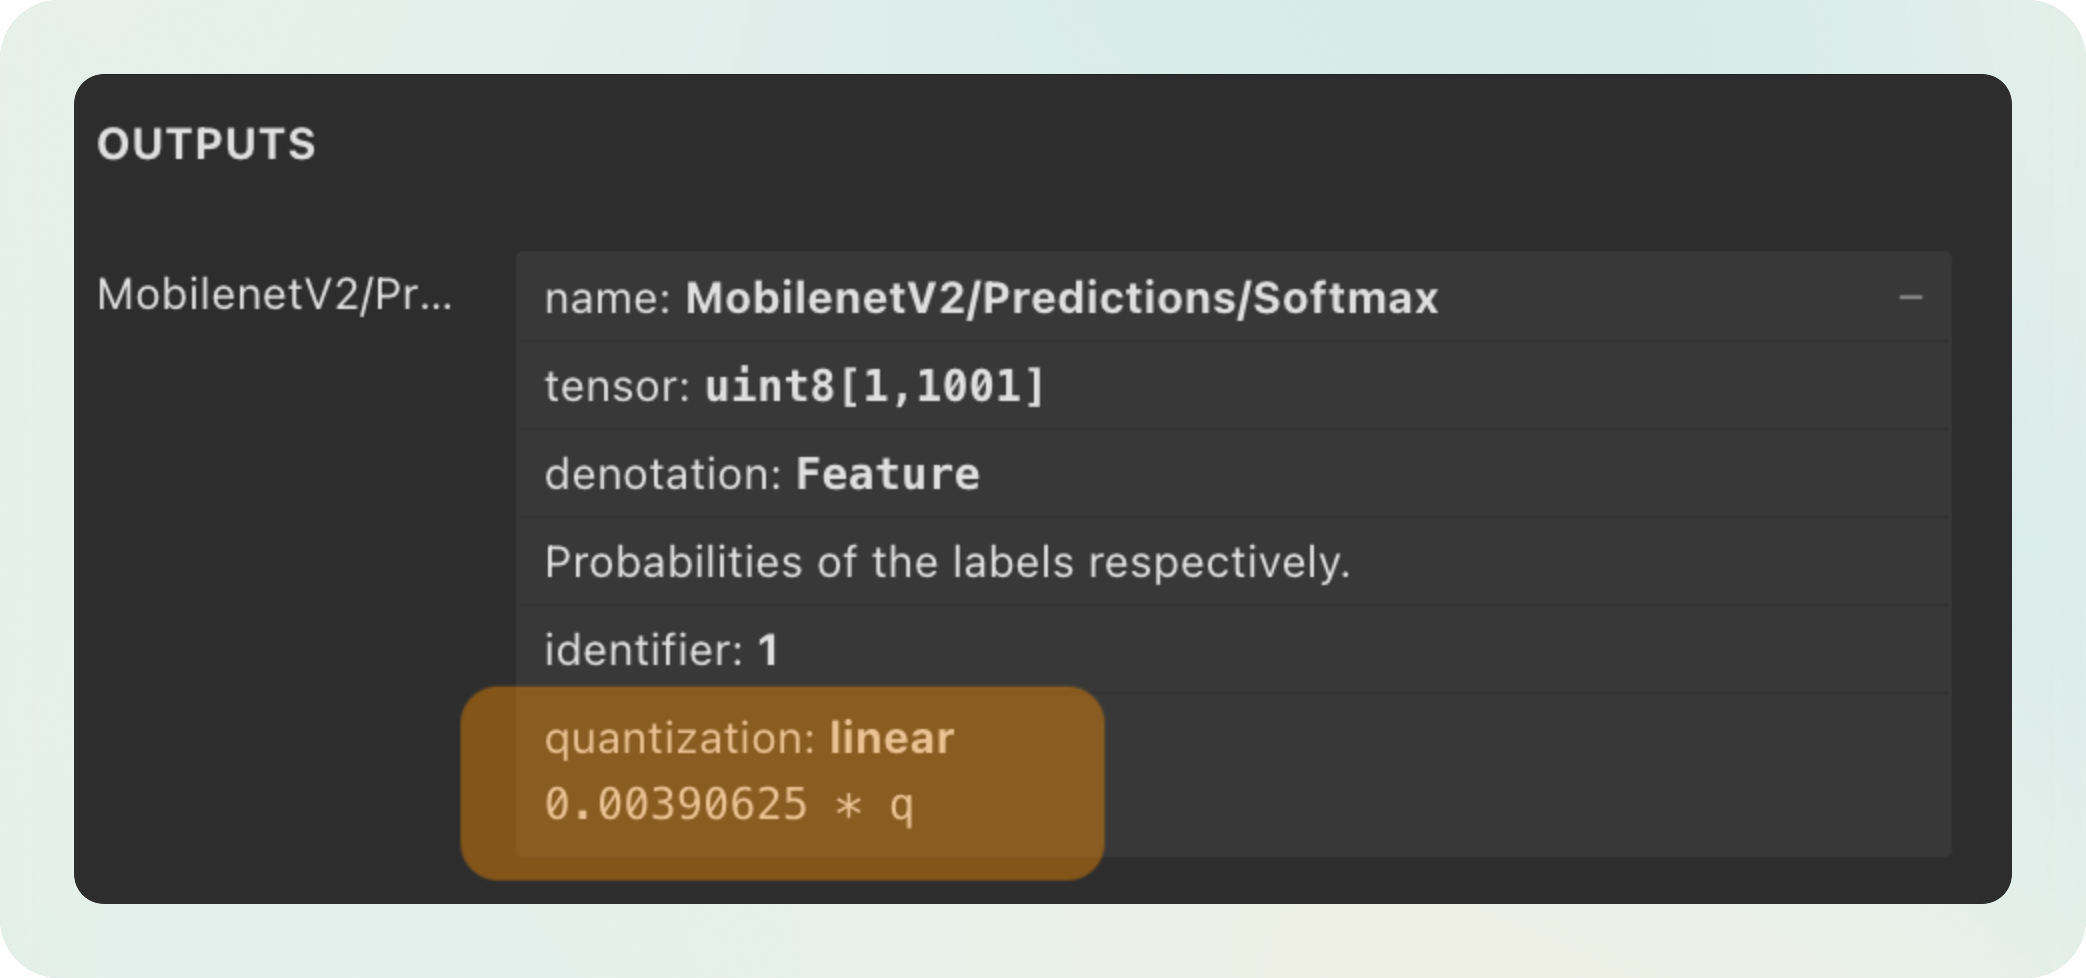
Applying the quantization formula above:
232 * 0.00390625-> 0.9062518 * 0.00390625-> 0.0703125
Which, if you remember, were the classification scores we saw before.
Yuhu 🥳! It seems that all the pieces in the puzzle have fallen into place!
Last remarks
I’ve condensed all the knowledge from this post into a single script. You can see it in my Github and, hopefully, it will not be difficult to follow after reading this post!